Data center power management modules are now available in device42 to help you monitor and control power in your data center.
These modules can help you save money on your energy bills, can help with capacity planning, and can help with business continuity planning and implementation.
Both of these modules make use of DCM technology licensed from Intel Corporation. Device42 pays a licensing fee to Intel for use of this technology. For this reason, device42 licenses this technology separately from the base product and the Energy Monitoring module is licensed separately from the Power Control module (which includes the Energy Monitoring module).
The Energy Monitoring and Power Control modules require installation of a second virtual appliance (you will already have installed the device42 virtual appliance that has the core functionality).
Actual vs. Estimated Power Values
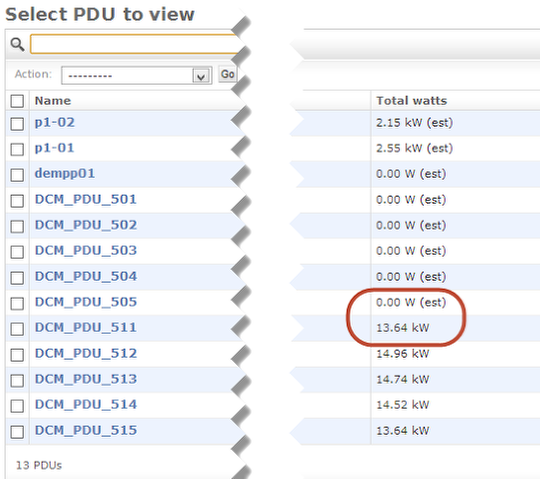
On the PDU list page above, you will see some of the Total Watts values have ‘(est) ‘ after the value. These are estimated watts that you have input for the pdu (or 0.00 if you haven’t entered an estimate).
The Total Watts numbers without an ‘(est)’ are actual instantaneous power values that were read from the device when the page was loaded.
PDU Energy Monitoring
If you click on one of the energy-aware PDU’s (i.e. one without an estimated Watts value), you will go to the View Page for that PDU.
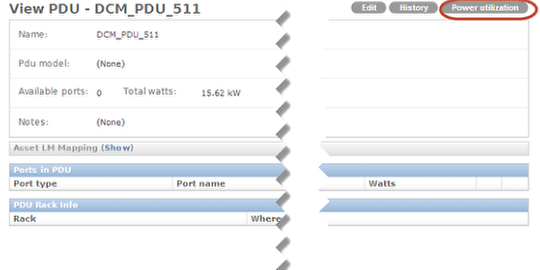
One of the options you will see is Power utilization button (highlighted in red). If you click that button you will see a page of charts…
PDU Power and Temperature Monitoring
On the left side of the charts page, you will see the latest power reading for the PDU.
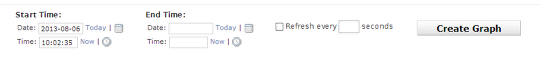
At the top right of the page, you will the time parameters for the page. By default, the two top charts on the page will show data for the prior 48 hour period. You can modify the start and end dates/times. You can also make this page a monitor by checking Refresh and entering the number of seconds before each refresh.
You will see the Start, End, and Refresh parameters in a number of different places in device42 where charts and graphs are displayed. They all work this same way.
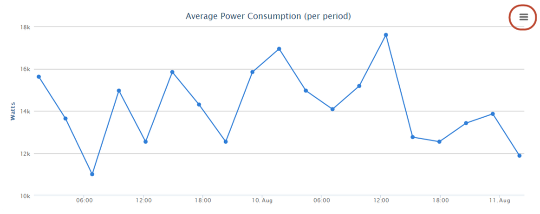
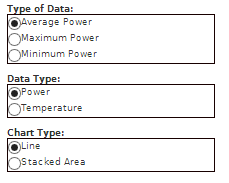
The first 2 charts you see on the page shows the Average Power Consumption over the last two days and the Average Inlet Temperature over the last two days.
You can print the chart in a number of formats by clicking the icon that is circled in red.
If you want to drill down to a shorter time period, click anywhere on the graph above a date/time that will start the drill down range, hold the click, and drag the mouse pointer to another date/time that will end the drill range as below…
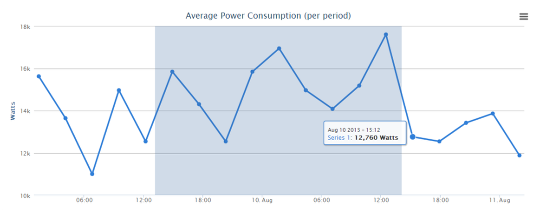
Then, when you release the mouse, the chart will repaint with the new timeframe…
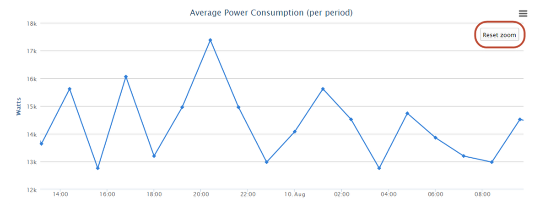
You can drill down further and further as many times as you’d like. Almost all charts that you see in device42 have the same drill-down and print capabilities. You also see (circled in red), a Reset Zoom button. This button will restore the graph to the original timeframe if this was the first drill down and will restore it to the timeframe before the most recent drill down if you’ve done multiple drills. If you’ve done multiple drills, you can keep clicking the Reset Zoom button until you are back to the original timeframe.
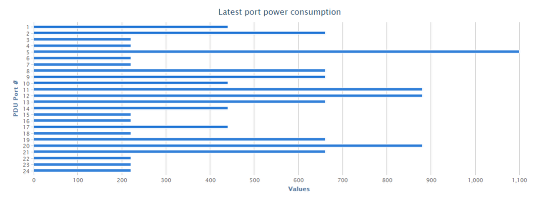
The last chart on the page show the latest port power consumption for each of the pdu ports.
Device Power and Temperature Monitoring
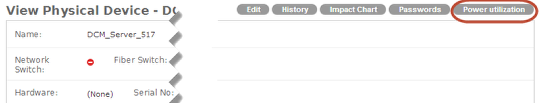
Like PDU’s, power-enabled devices will have a Power utilization button. When you click the button, you will see Start / End Date / Time fields just like for PDU’s, you will see just Power and Temperature charts (it wouldn’t make sense to show power to non-PDU device ports), and you will see 3 power values on the left side of the page (where the PDU page had just 1 value):
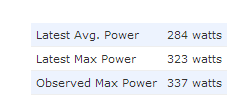
The 3 values you will see are:
– Latest Avg Power: This is the average power usage over the most recent 6-minute period
– Latest Max Power: This is the maximum power usage over the most recent 6-minute period
– Observed Max Power: This is the maximum power usage observed in the timeframe set by the Start and End Dates/Times.
Room / Rack Power and Temperature Monitoring
If you go to Reports >> Power, you will see a set of selections on the left side of the screens that determine whether the chart will show data for individual devices or pdu’s, or whether that data will be rolled up to the rack, room, or building level.
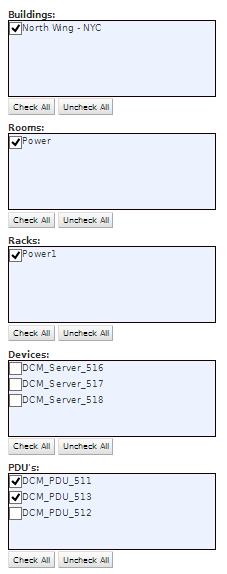
You will first see a Buildings listbox that contains each building that has at least one room that has at least one rack that has at least one device or pdu that is enabled for power and/or temperature monitoring. In our example above, there is just one building. Below the Buildings listbox, you see a Rooms listbox, then Racks, then Devices, and then PDU’s.
If you select (i.e. check) one or more Buildings, and uncheck all the Rooms, then the chart will show power/temperature data aggregated up to the Building level.
Similarly, if you select one or more Rooms and uncheck all the Racks, then the chart will show power/temperature data aggregated to the Room level.
If you select one or more Racks and uncheck all the Devices and PDU’s, then the chart will show power/temperature data aggregated to the Rack level.
If you select one or more Devices, then the chart will show one power/temperature line on the chart for each Device selected.
If you select one or more PDU’s, then the chart will show one power/temperature line on the chart for each PDU selected.
You can also make 3 selections regarding the Type of Data that will be displayed:
– If you select Average Power, you will see the Average Power for each time period displayed in the graph
– If you select Maximum Power, you will see the Maximum Power for each time period displayed in the graph
– If you select Minimum Power, you will see the Minimum Power for each time period displayed in the graph
In the Data Type box, you can select:
– Power: To display power data
– Temperature: To display inlet temperature data
In the Chart Type box, you can select:
– Line: To produce a line graph
– Stacked Area: To produce a stacked area graph
Then, click the Create Graph button and you will see the graph…
As with the other charts and graphs, you can print (icon highlighted in red above) and drill down.
PDU Power Control
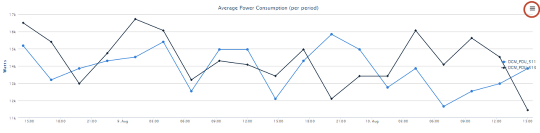
If you go to Datacenter >> PDUs and click on a PDU to get to the PDU’s view page and then click the Edit button to get to the PDU’s edit page, you will see On/Off buttons for the individual PDU ports like the ones below.
As expected, clicking the button once will turn off the port and cause the On/Off slider to change to the Off position. Clicking the button again will turn the port back on and cause the On/Off slide to change back to the On position.
Please note that you will only see these buttons for a PDU that is power-enabled and is capable of remote power control.
Device Power Control
Similarly, if you go to Devices >> Physical Devices, click on a power-enabled device, and click the Edit page for that device, you will see an On/Off button for the device.
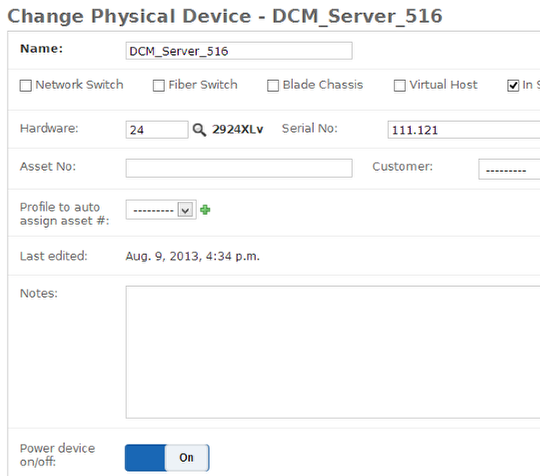
Clicking the button once will turn off the device and cause the On/Off slider to change to the Off position. Clicking the button again will turn the device back on and cause the On/Off slide to change back to the On position.
Please note that you will only see these buttons for a Device that is power-enabled and is capable of remote power control.
The first policy above is a simple power limit on a server that is enforced during peak business hours.
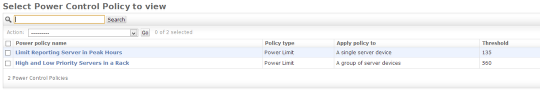
Power Control Policies
Power Control Policies give you the ability to limit the amount of power used by a device based on a number of factors. Go to Datacenter >> Power Policies to create, view, or edit your power control policies.
Below, we’ll discuss two policies that we’ve created for illustration and then explain in detail how to create and use power policies.
Single Device Policies
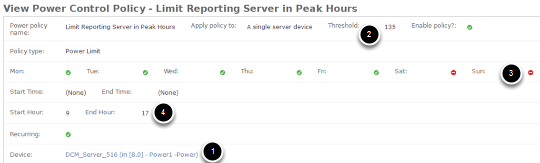
In the above example, we are limiting a specific device (1) to a maximum of 135 watts (2). The policy is effective Mon-Fri (3) during the hours of 9am to 5pm (4).
Group Policies
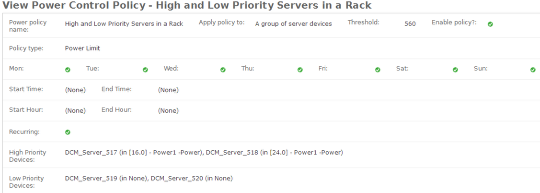
This example is a bit more complex. We have defined a policy for a group of 4 servers (1). The 4 servers combined have a total power maximum of 560 watts (2). However, 2 of the devices are labeled high-priority (3) and 2 a labeled low-priority (4). The policy is in effect 24×7.
You would use this type of policy if for example you have a rack that has some production servers that need maximum performance and some reporting servers that can run more slowly if power is constrained. When a policy like this one applies to a group, Intel(R) DCM actively reallocates the power budgets to the individual servers within the group whenever the total power demand of the group exceeds the Threshold specified for the power policy (or exceeds the power limit of the PDU(s) supplying the servers). It attempts to minimize the gap between power demands of servers and power allocation, in order to minimize the performance impact of the group power capping. Intel(R) DCM monitors the power consumption data of the servers, estimates the power demand of the servers, and reallocates the power budgets with a sophisticated approach by applying a heuristic discriminative approach to solve a probabilistic model. In general, Intel(R) DCM reacts quickly by allocating more power budgets to servers to get new tasks running properly. The policies are commonly applied to increase the server density with respect to power or cooling capacity.
A group policy can be set either for a group of servers or for a group of pdu’s.
Policy Control Options
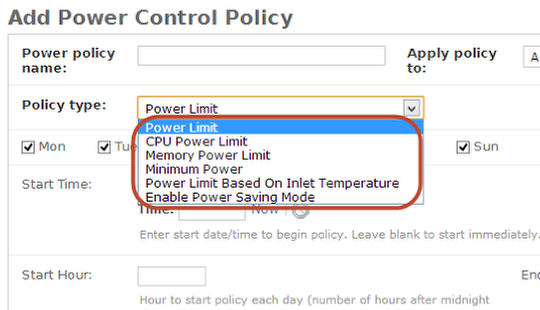
Six types of power policies can be specified:
- Power Limit: This option forces a device (or group of devices) to be capped with a fixed power limit. Use this policy to explicitly dictate the power budget allocation or the power throttling level when the appropriate power budgets of the devices are known.
- CPU Power Limit: This option throttles the power consumption of the server’s CPU sub-system to keep it below the defined Threshold. This policy type can only be applied to single servers and not to groups of devices.
- Memory Power Limit: This option throttles the power consumption of the server’s memory sub-system to keep it below the defined Threshold. This policy type can only be applied to single servers and not to groups of devices.
- Minimum Power: This option throttles power consumption of a device as much as possible. Use this policy to prolong business continuity in the case of an emergency.
- Power Limit Based On Inlet Temperature: This option throttles the power consumption of the device as much as possible when the average inlet temperature exceeds the Threshold. Use this policy to prolong business continuity in the case of datacenter cooling system failure. Please note that for this option, the Threshold specified is in degrees Celsius.
- Enable Power Saving Mode: This option forces the server to its most power efficient state, that is the P-state with the lowest performance and power without clock throttling. The effect may be overwritten by an extreme low power budget allocated from other policies or by a Minimum Power policy for the device.
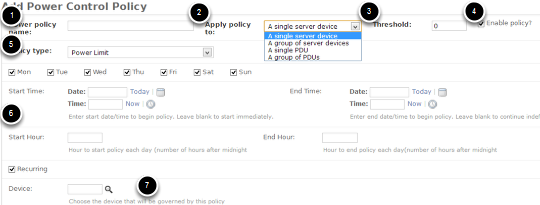
To create a new policy, go to Datacenter >> Power Policies and click the Add button.
Each policy must have a name (1).
The first dropdown (2) enable you to select whether the policy applies to a single server or pdu or a group of servers or pdu’s.
The Threshold (3) will be Watts for all Policy Types except Power Limit based on Inlet Temperature. For Inlet Temperature, the Threshold will be in degrees Celsius.
The Enable Policy checkbox (4) is checked by default. Uncheck this box if you want to disable the policy without deleting it.
The Policy Type (5) is discussed above.
The Dates/Times (6) for which the policy is in effect can be set by choosing certain days of the week plus a start hour. Checking the recurring box will put the policy in effect indefinitely. Alternatively, you can choose a start and end date/time. Leaving these blank (without choosing days of the week) will cause the policy to be put in effect immediately and continue indefinitely.
The Device / PDU (7) or groups of Devices / PDUs must also be specified. Obviously, this selection will change based on your Apply Policy To (2) selection.
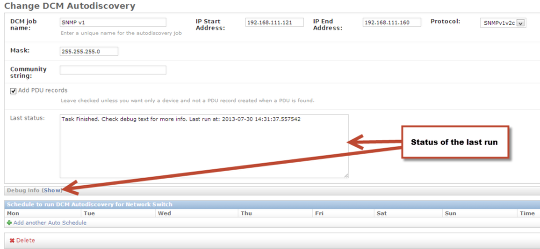
DCM auto-discovery
For state of the art energy monitoring, power, and data center management software, check out device42.