CMDB Visualization: Best Practices With Examples
Configuration management database (CMDB) is an ITIL term for a database used to store information about hardware and software artifacts that are known as configuration items (CI). A CMDB also contains the relationships between the CIs which makes it capable of representing business services as a top-down hierarchy of interrelated CIs.
A CMDB is only effective if its stored data is comprehensive and accurate and if users can easily interpret the information provided by the data. However, understanding raw data in a CMDB can be challenging because of the large volume of data and complex dependencies.
CMDB visualization analyzes the attributes and dependencies of configuration items (CIs) stored in a CMDB to graphically display information relevant from the perspectives of various business and IT stakeholders.
In this article, we’ll explore the topic of CMDB visualization in depth, including the various personas who access information stored in a CMDB, different types of CMDB visualizations, and CMDB visualization best practices.
CMDB visualization types
At a high level, visualizations for CMDB can be grouped into common data visualization categories like charts, tables, graphs, dashboards, and maps. However, there are plenty of subcategories within those broad groupings.
Understanding that nuance starts with understanding the typical user personas and use cases. CMDB visualization requirements vary depending on a user’s role in an organization. For example, an executive will usually be interested in an overall compliance score, while an engineer uses CMDB data for ticket resolution.
The table below explains the typical personas and use cases for CMDB visualization. In the following sections, we’ll take a closer look at each of these use cases and the visualizations that help address them.
CMDB visualization types
| Persona | Use Case |
|---|---|
| IT Executive | Uses CMDB data as a decision support system for strategic decisions like audit, compliance, and cost efficiency |
| IT Service Manager | Uses CMDB data to manage the delivery, performance, and uptime of IT services |
| CMDB Manager | Uses CMDB data to understand the health and accuracy of a CMDB inventory |
| Project Manager | Uses CMDB data to manage the allocation of IT infrastructure resources and funding to various business initiatives |
| Information Security Manager | Uses CMDB data to manage risks and vulnerabilities of sensitive items |
| IT Engineer | Uses CMDB data to plan and release changes, migrate applications, and to investigate the root cause of incidents and problems |
CMDB visualizations for IT executives
CMDB visualizations for IT executives provide information to help inform strategic decisions, planning, and summarize overall infrastructure health.
Audits and compliance
Ensuring regulatory compliance across an organization is an essential executive function, and CMDB visualizations can help. For example, an IT executive may want to determine what critical business services in the organization comply with the Sarbanes–Oxley Act of 2002 (SOX).
As part of a SOX IT audit, internal security controls and procedures are reviewed using the COBIT framework for IT Compliance. It’s worth noting that transient configuration items are not auditable and should be excluded. An example of a transient CI would be a CPU process or a disk partition. This is one of the many reasons why a CMDB should have powerful grouping and filtering capabilities, in this case, able to create groups for the auditable CIs. This audit is performed on relavant sensitive configuration items and focuses on 4 key areas:
- IT Security: Ensuring sensitive data is secured and any user accesses to such data is monitored and prevented
- Access Control: Ensuring Physical access to secured spaces such as data centers and digital access to secured systems using authentication and credential management system are appropriately managed and given to authorized users only
- Change Management: Evaluating changes to the software are managed and recorded properly
- Data Backup: Evaluating how organization backs up data and key services to minimize disruption in the event of data loss
Controls are usually established based on those key areas. The controls can then be tested against relevant applications listed in the CMDB and displayed in a report.
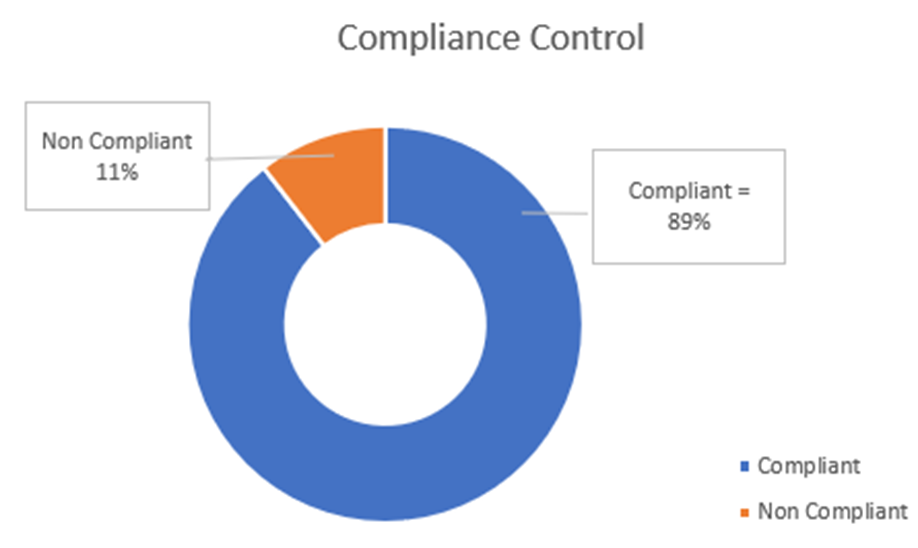
A CMDB visualization summarizing overall compliance percentage.
Cost reporting
IT executives may also want to monitor the overall volume and cost of IT services and products in an organization. Volume can be extracted directly from a CMDB whereas the financial information can be obtained by integrating a CMDB with an asset management system.
For example, this chart shows the volume of end-user hardware by vendor.
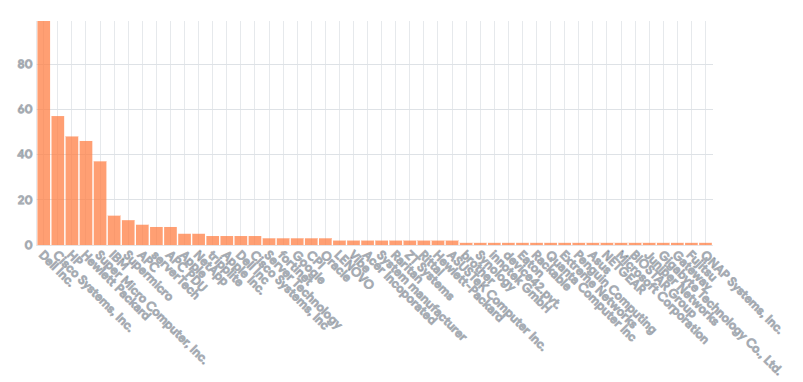
If this information is fed into the Asset Management system, IT executives can get a view of the cost of the asset as well. The most advanced products in this market conveniently combine a CMDB functionality and an asset management system into a single platform.
Executives may also want to break down IT costs at the regional level to inform decisions on improving services by location, reducing costs, and managing the risks associated with the infrastructure.
CMDB visualizations for IT service managers
Use cases for IT service managers deal with the performance, health, and availability of IT infrastructure.
Availability and uptime reporting
IT Service Managers are responsible for establishing and monitoring Service Level Agreement (SLA) and business service availability.
In CMDB, a business service is usually represented on top in a hierarchy of classes and is linked to underlying application CIs which are inturn linked to dependent infrastructure CIs such as server and database. The availability of the business service is usually calculated by rolling up availability of their dependent CIs
IT service managers rely on reports such as the availability report in the table below. As an example, the table compares actual availability to expected availability. Such reports are typically produced by a monitoring system or an ITSM tool aided by service mapping insights dynamically discovered by a feature-rich platform centered around a CMDB functionality.
Availability report
| Business Service (pulled from CMDB) | Expected availability | Actual availability | Outage |
|---|---|---|---|
| 99.9% | 99.4% | 0.6% | |
| Workday Services | 99.9% | 100% | 0 |
| SAP Services | 99.9% | 100% | 0 |
Manage IT services
An IT services manager can estimate application performance and availability by monitoring the number of incidents reported per application CI.
For example, the table below displays a list of applications, the number of incidents grouped by application, and the severity of those incidents. With all that data aggregated in a single table, IT service managers have a heat map to identify at a glance the applications with severe issues. This type of report is usually generated by an ITSM or monitoring tool integrated with a CMDB platform that is augmented with a software module capable of discovering dependencies between applicaiton services and configuration items.
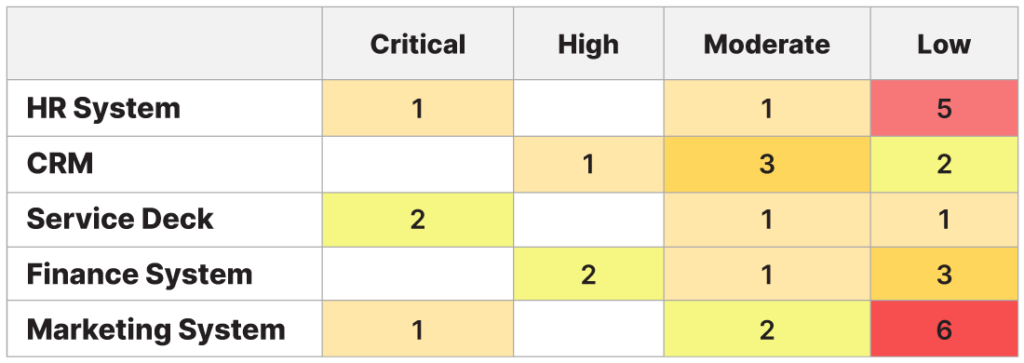
Incident heatmap by business service (CI) and priority

Maintenance and upgrade planning
Similarly, an IT Service Manager may use CMDB data to monitor the CIs subject to the highest number of changes. With this information, they can plan maintenance and upgrades.
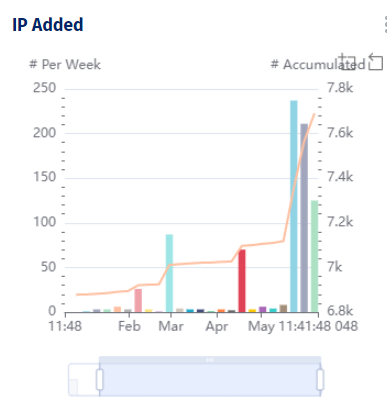
Change per (CI) breakdown by week
CMDB visualizations for CMDB managers
CMDB managers use visualizations to ensure that the CMDB system itself is performant, accurate, and available.
CMDB Health
CMDB managers must monitor and maintain data quality in a CMDB. Effective CMDB monitoring requires metrics related to the data completeness, correctness, and compliance.
Data Completeness
Data completeness refers to the collected CI attributes and indicates whether the data includes the required or recommended attributes. For example, while setting up a CMDB, the hostname and the firewall status of a server may be defined as required attributes, while information about the server’s operating system may only be a recommended attribute.
Data Compliance
Data compliance indicates if all the CIs contain data compliant with CMDB policies. For example, you may have a policy requiring each critical business service to identify a technical support escalation group.
Data Correctness
Data correctness measures a CMDB’s duplicate, stale, and orphan CIs.
Application Mapping
Application mapping and relationship linkage can also measure the health of a CMDB. Specifically, these metrics help quantify the percentage of CIs that have an upstream or downstream dependency and helps ensure the CIs are presented in the context of the applications they support.
CMDB visualizations for project managers
Project managers use CMDB data to get an accurate count of infrastructure items available for a project to help estimate funding and resource allocation.
Resource availability
The table below provides an example of resource availability data that project managers can use for project planning.
Resource availability report
| Available Project Resources (CI) | Quantity | Location | Status | Assigned |
|---|---|---|---|---|
| Virtual Machine | 1 | Virtual | Operational | Unassigned (available) |
| Mobile | 2 | Onsite | Operational | Unassigned (available) |
Project Managers can also leverage CMDB to track and engage the appropriate support teams during project initiation. For example, project managers can use the type of information shown in the table below for support and escalation.
Assigned support and escalation contacts
| CI | Level 1 Support group | Escalation group |
|---|---|---|
| Server A | Linux Server Operations | Server Engineer |
| Server B | Windows Server Operations | Server Engineer |
CMDB visualizations for information security managers
An information security manager uses CMDB visualizations to help monitor risks and vulnerabilities.
Risks
Reports based on CMDB data can help infosec managers quantify risk by visualizing infrastructure items that are compliant versus risky.
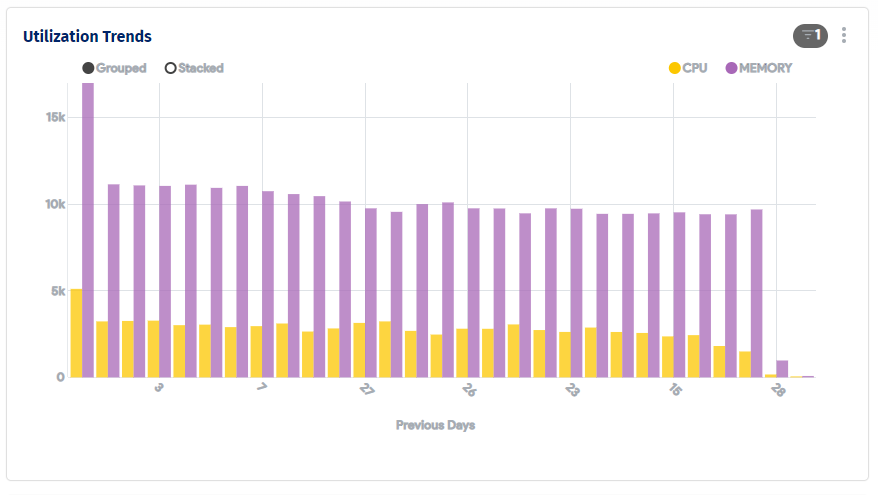
For example, the sample report below displays a list of compliance discrepancies (e.g., a trend of CPU and Memory Utilization) for servers supporting critical business services.
Vulnerabilities
Information security managers often monitor vulnerabilities on sensitive infrastructure items such as IP addresses, connection protocols, patch levels, or End of support (EOS)and End of life (EOL) of critical services by running tests. CMDB visualizations can make summarizing and tracking test results easy.
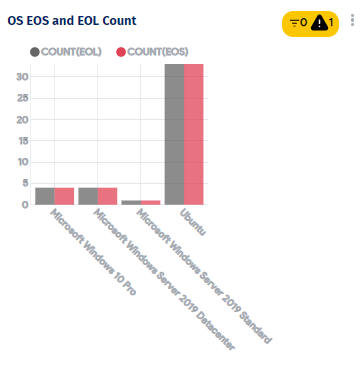
An example vulnerability report created from CMDB data.
CMDB visualizations for IT engineers
An IT engineer can leverage CMDB visualizations to support change management, issue remediation, and root cause analysis workflows.
Planning changes
When building, testing, and deploying changes to production, engineers need to mitigate risk. Ensuring changes are deployed at a specified time that doesn’t conflict with other changes are two important aspects of effective change management. Without proper planning, conflicting changes and user impact can lead to lost time and productivity.
For example, an applicable outage may result if a database version is updated without first coordinating the upgrade with test engineers responsible for dependent applications.
In a separate use case, integrating a change management system with a CMDB allows engineers to plan their changes properly and identify conflicts.
Impact analysis and resolving incidents
CMDB data can help engineers conduct impact analysis and escalate incidents for a quicker resolution. Once an incident is identified and linked to a CI, engineers can go through related dependencies and predict its impact on upstream business services.
A CMDB visualization of dependencies can also help engineers to escalate issues to the appropriate support teams by visualizing the support systems. For example, if a network printer isn’t working, service desk engineers can escalate to the underlying server team by looking at downstream server data in a CMDB.
Root cause analysis
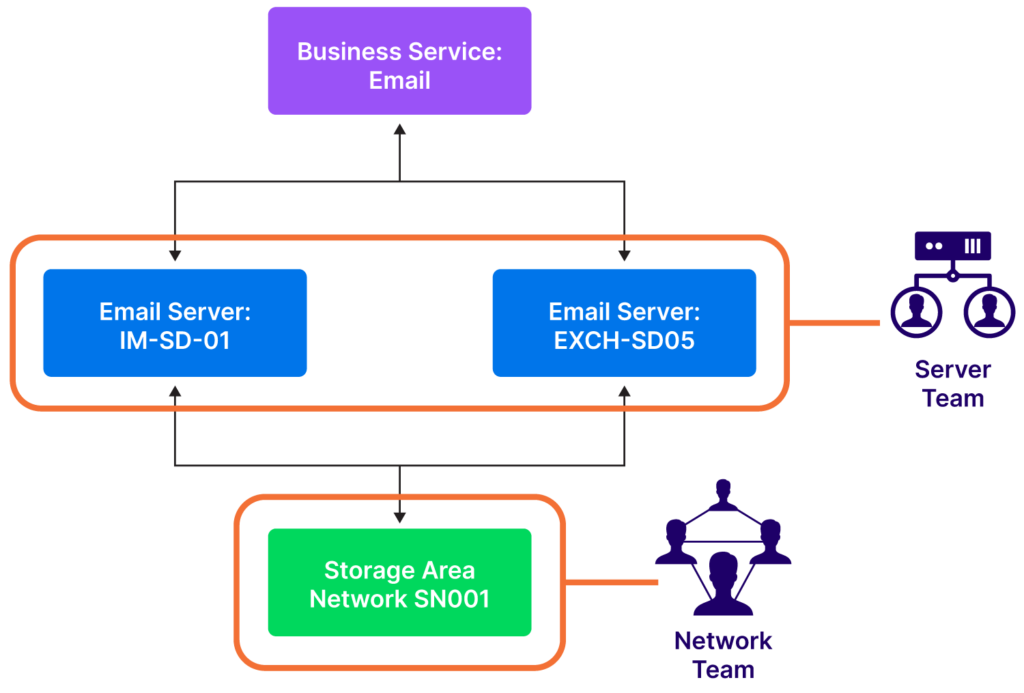
CMDB problem management data helps in the root cause analysis of CI incidents. For example, multiple issues with email service from different users could be due to problems with underlying mail server upgrades or network components.
CMDB data helps identify underlying servers and network components associated with the email server. Once the underlying server and network components are identified, the server and network teams can investigate further.
Plan data center migration
Data center migrations require significant planning and effort due to their complexity and dependencies. CMDB dependency maps allow proper relocation of CIs based on their dependencies and thus help avoid service disruptions during migrations. For example, multiple applications may depend on a database instance in a data center. Migrating a shared database without knowing all of its dependencies could result in an outage. CMDBs can also help with post-mortem analysis when something goes wrong during a data center migration.
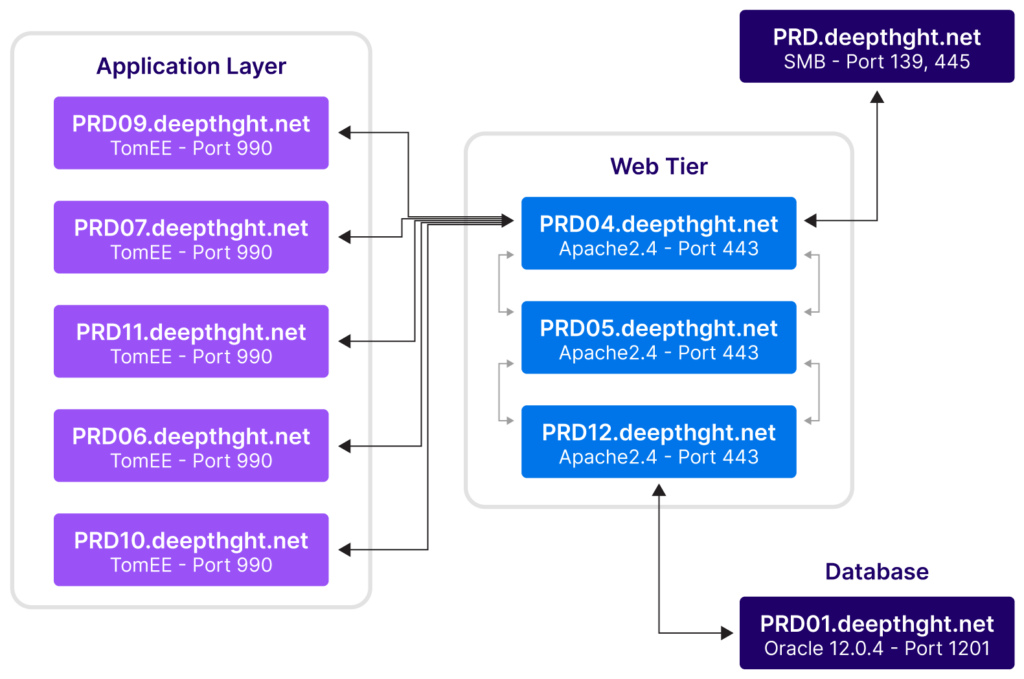
The sample view shared below of an application dependency map can help you relate to notion of using an auto-discovered dependency map to avoid moving components that support multiple applications without synchronizing the move. The “move group” feature of advanced CMDBs help migrate interdependent components together and avoid unintended outages.
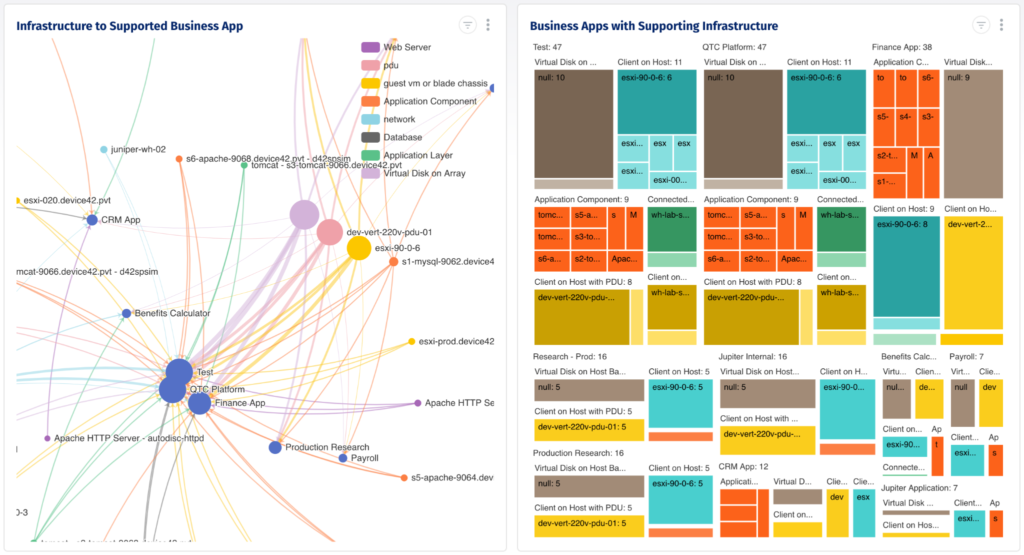
A dependency map can help migrate interdependent components as a group
Migrations must also plan for the physical moving of hardware equipment into or out of data center racks. The CMDB visualization below can give you an idea how the view of a data center layout, rack space, and cabling can bring the clarity required to plan in detail the physical relocation aspects of a data center migration project.
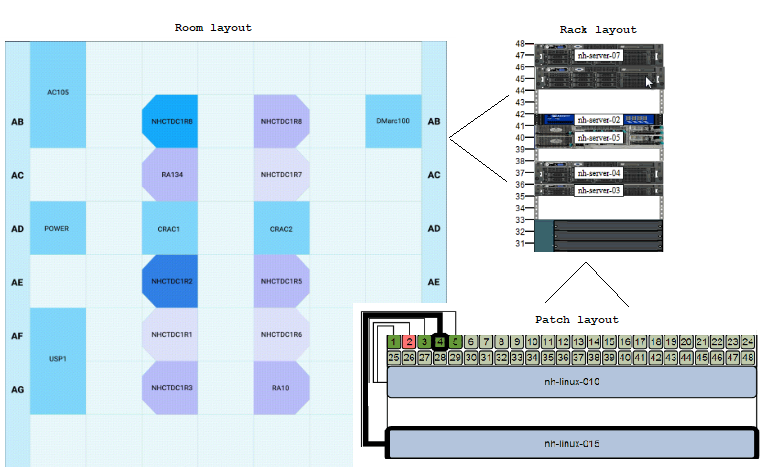
Datacenter Room Rack and Patch Layouts
CMDB best practices: challenges and recommendations
Many organizations find it challenging to balance the need for details and the resulting complexity in a CMDB. Including too much too soon can be inefficient and expensive. Not including enough means missing out on meaningful insights.
To use CMDB visualizations effectively, organizations must strike a balance. To help you find that balance, in the sections below, we’ll review common CMDB challenges and the recommendations that can help address them.
Align CMDB with organizational strategy
Keep the end state in mind when laying the foundation for CMDB. Your CMDB reports should align with business priorities to bring strategic value. Therefore, your CMDB planning should start with defining business use cases and organizational goals.
For example, a business priority may be to improve security posture and compliance. A specific business use case could be ensuring SOX IT audit compliance on all infrastructure items that have sensitive information.
To address the use case, you’ll need to include the required CI attributes in the CMDB schema to identify the components that have access to sensitive data and therefore require SOX-related protections and audits.
Classify your CIs and attributes early
Before you set up CMDB visualizations, you must classify the CIs and attributes you want to capture. For example, suppose an application supports a critical business service, and an underlying server and database support that application.
You will need visibility into all three layers. Therefore, you should define each layer as a class and model the appropriate dependency relationships in your CMDB as shown in the example below.
Follow best practices for CMDB visualization setup
When starting with CMDB visualization, first configure views that provide insights into the health of a CMDB. Once CMDB data is reliable and the health score reaches a reasonable value, integrate it with the incident, problem, and change management systems.
This framework will allow you to display the relationship between CIs for troubleshooting, change management, impact analysis, and issue remediation. With that foundation in place, you can set up consistent and clear reports for your various organizational personas.


Fastest time to value with easy implementation and agentless asset discovery

Comprehensive hardware and software inventory management

Broadest discovery from legacy technology to the latest cloud and containers
Summary
To summarize, key dependencies for effective CMDB visualizations are:
- Well-defined CI classes and CI relationships
- Reliable and high-quality data
Once that framework is in place, integrate your CMDB with ITSM processes such as incident management workflows. Then, you can address use cases for specific personas and enable:
- Executives to make strategic decisions
- IT service managers to deliver services effectively
- CMDB managers to continuously monitor and manage the health of CMDB
- Project managers to set up and manage project infrastructure resources
- Information security managers to manage risks and vulnerabilities
- IT engineers to handle service incidents and change management