
The First-of-Its Kind
IT Discovery & Reporting With Actionable Insights
Insights+ empowers you to make better, more informed decisions through integrated
analytics & visualization, leveraging the breadth and depth of Device42 asset discovery information.
Most Popular Use Case Examples of Insights+
Audit &
Compliance
Reduce commitment time
for compliance & audits by 85%.
Incident
Management
Improve incident response
by at least 30%.
IT Infrastructure
& Capacity Optimization
Improve IT resources
Efficiency by 60%.
![]()
Sustainability Insights & Power Reduction
Reduce Power Costs and CO₂ emissions by 30%.
Spot Trends and Balance Workloads for More Effective Capacity Planning
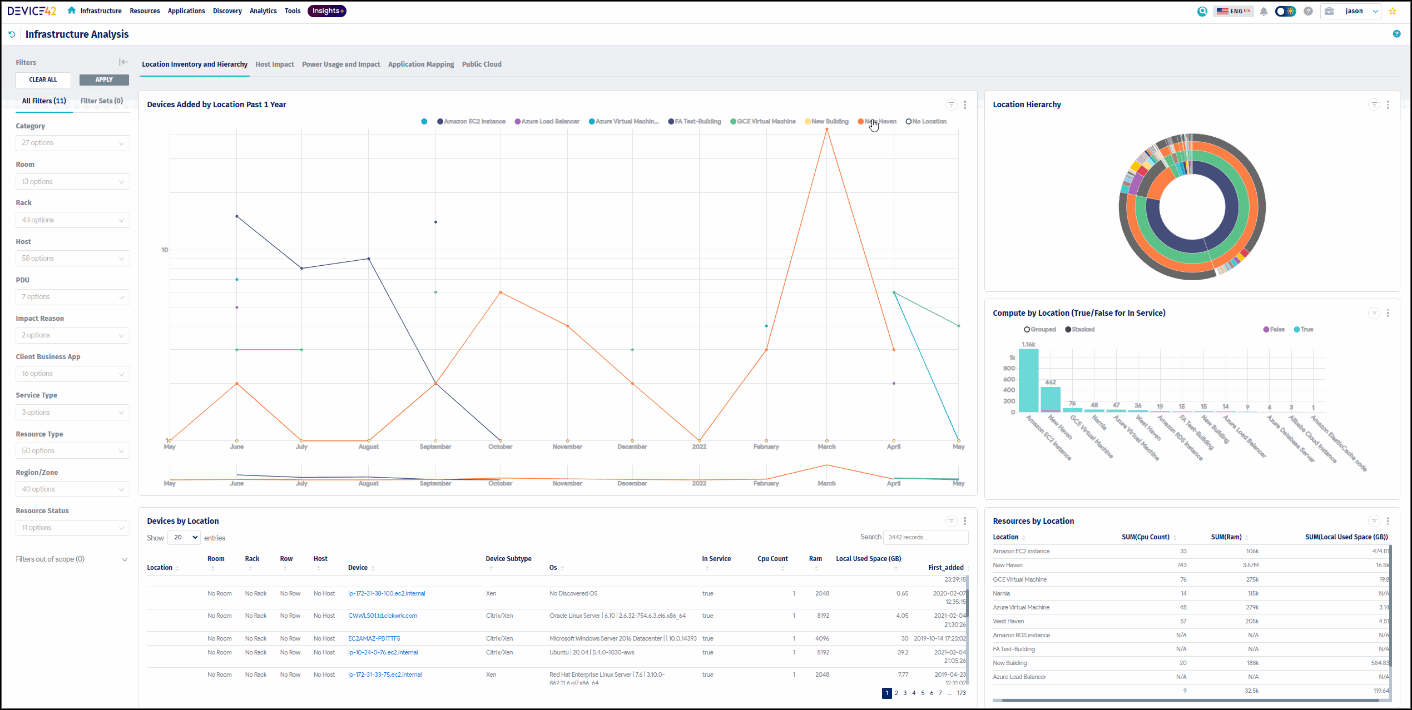
The Location Inventory and Hierarchy Dashboard provides you an aggregate view of where resources are deployed and the distribution of those resources. You can spot trends and ensure that resources are balanced across locations and initiatives for effective capacity planning.
Balance Compute and Memory Across Hosts with Real-World Data
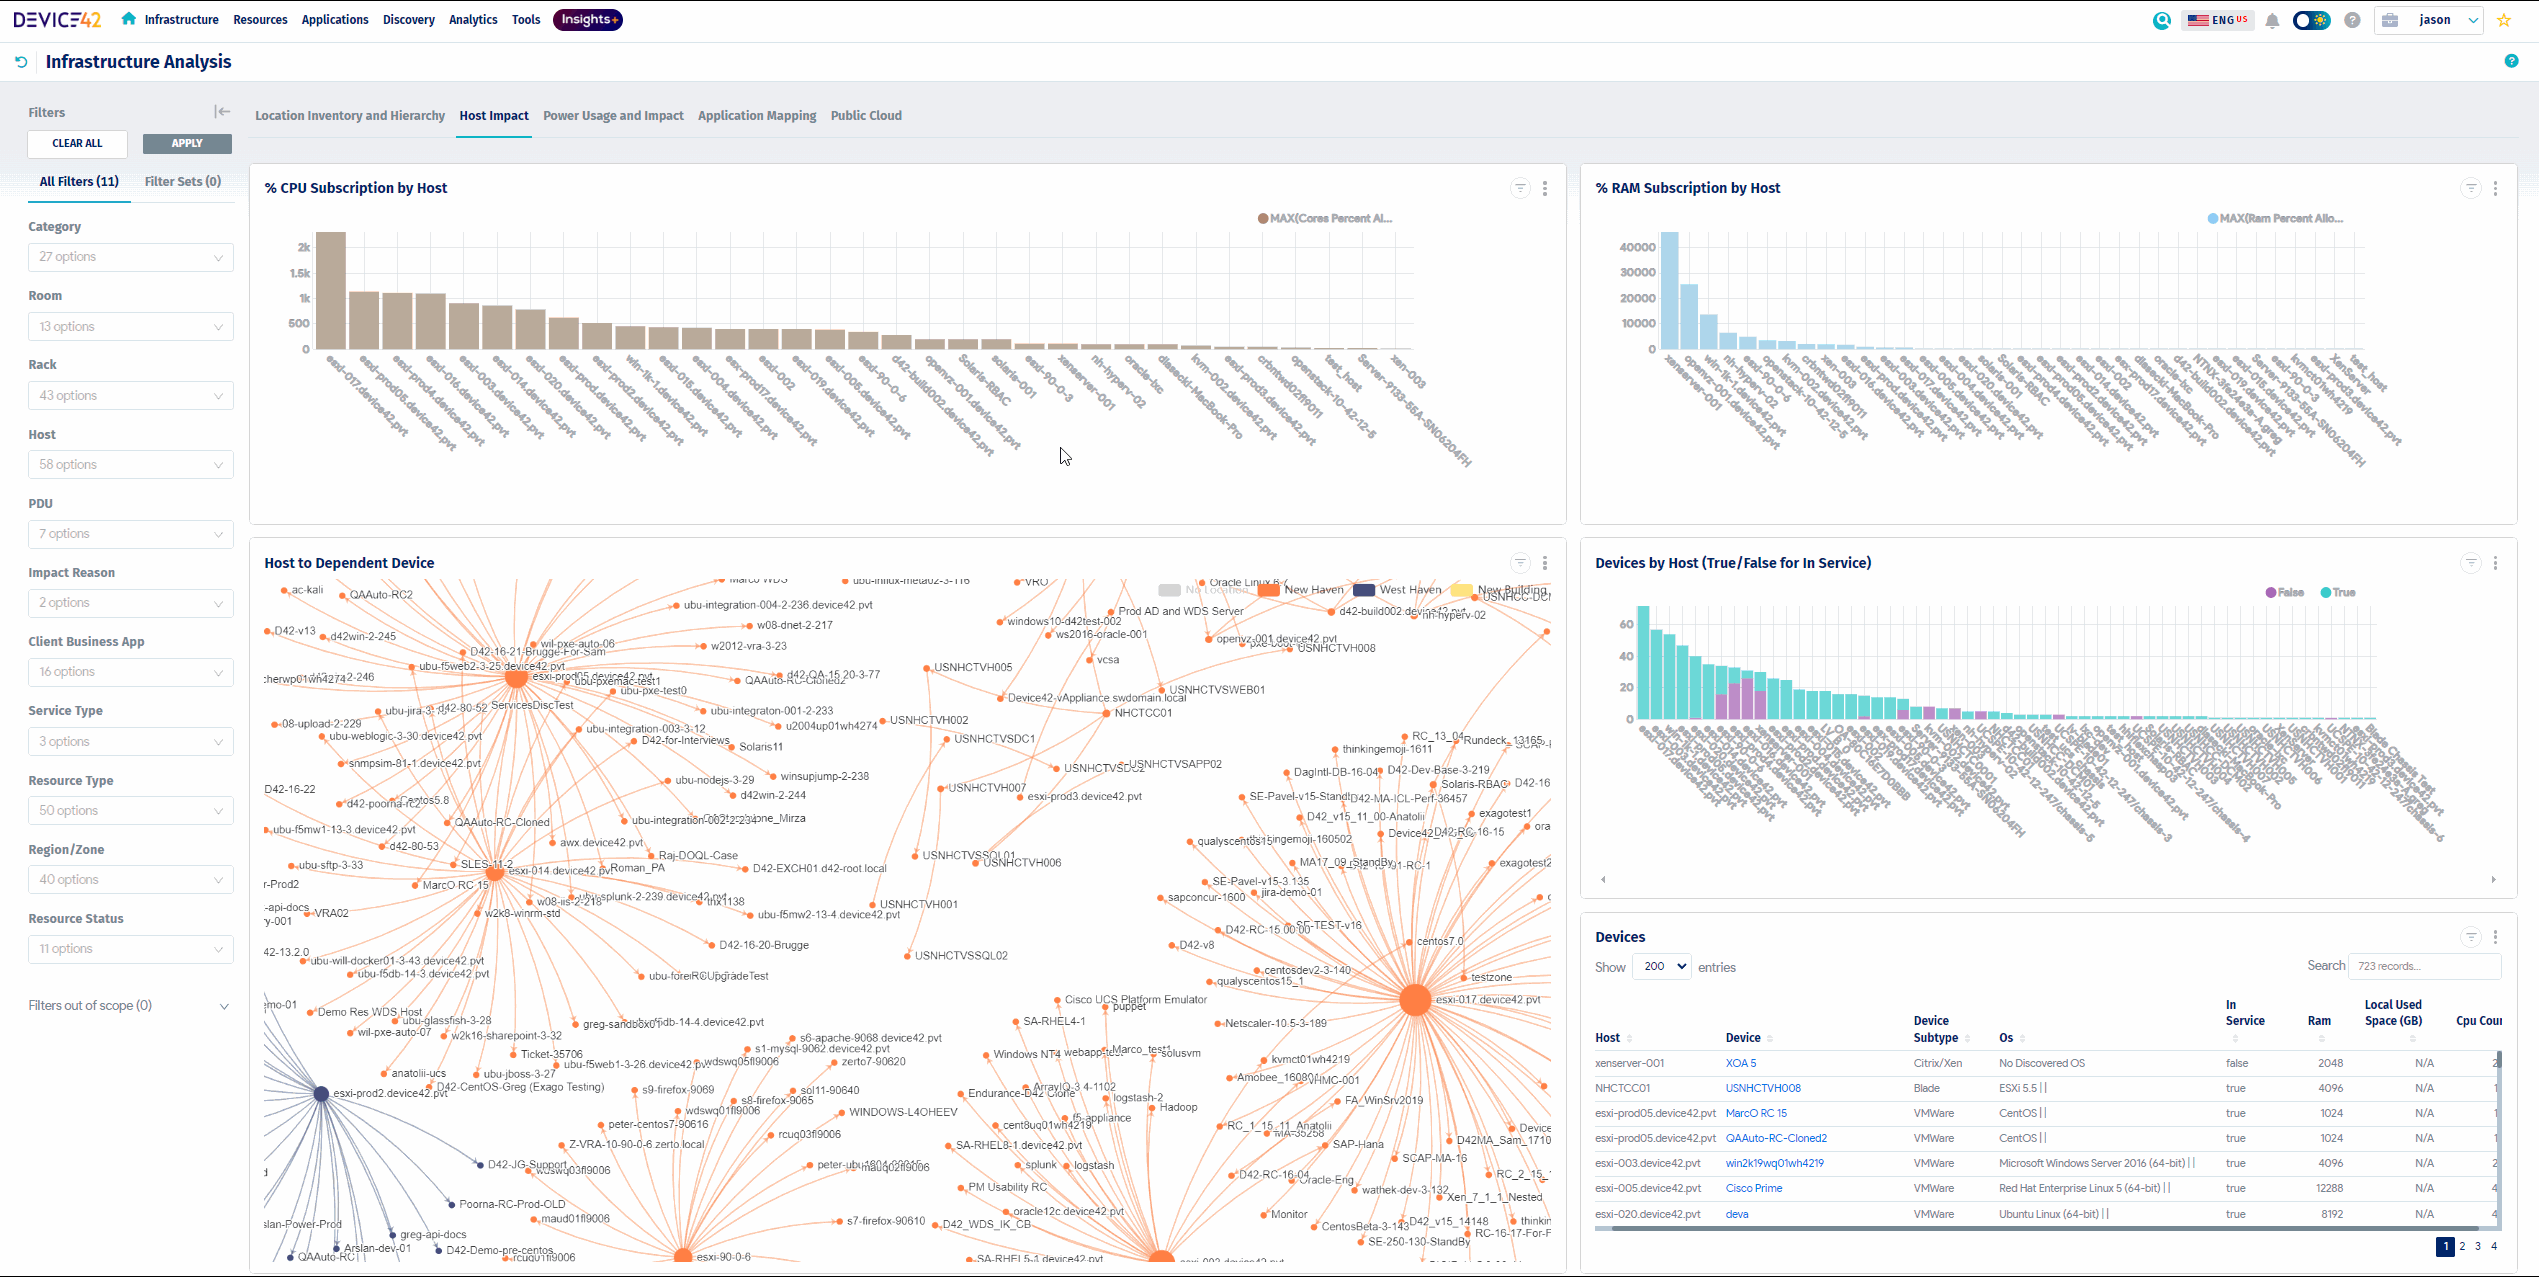
The Host Impact Dashboard monitors the allocation of compute and memory resources to hosts and displays the aggregate view of host performance across your entire environment. This helps you plan for evenly balanced workloads across hosts by identifying risks associated with oversubscribed hosts and inefficiencies where capacity isn’t being used.
Manage Power Cost, Document Your Carbon Footprint, and Mitigate Risk of Failure
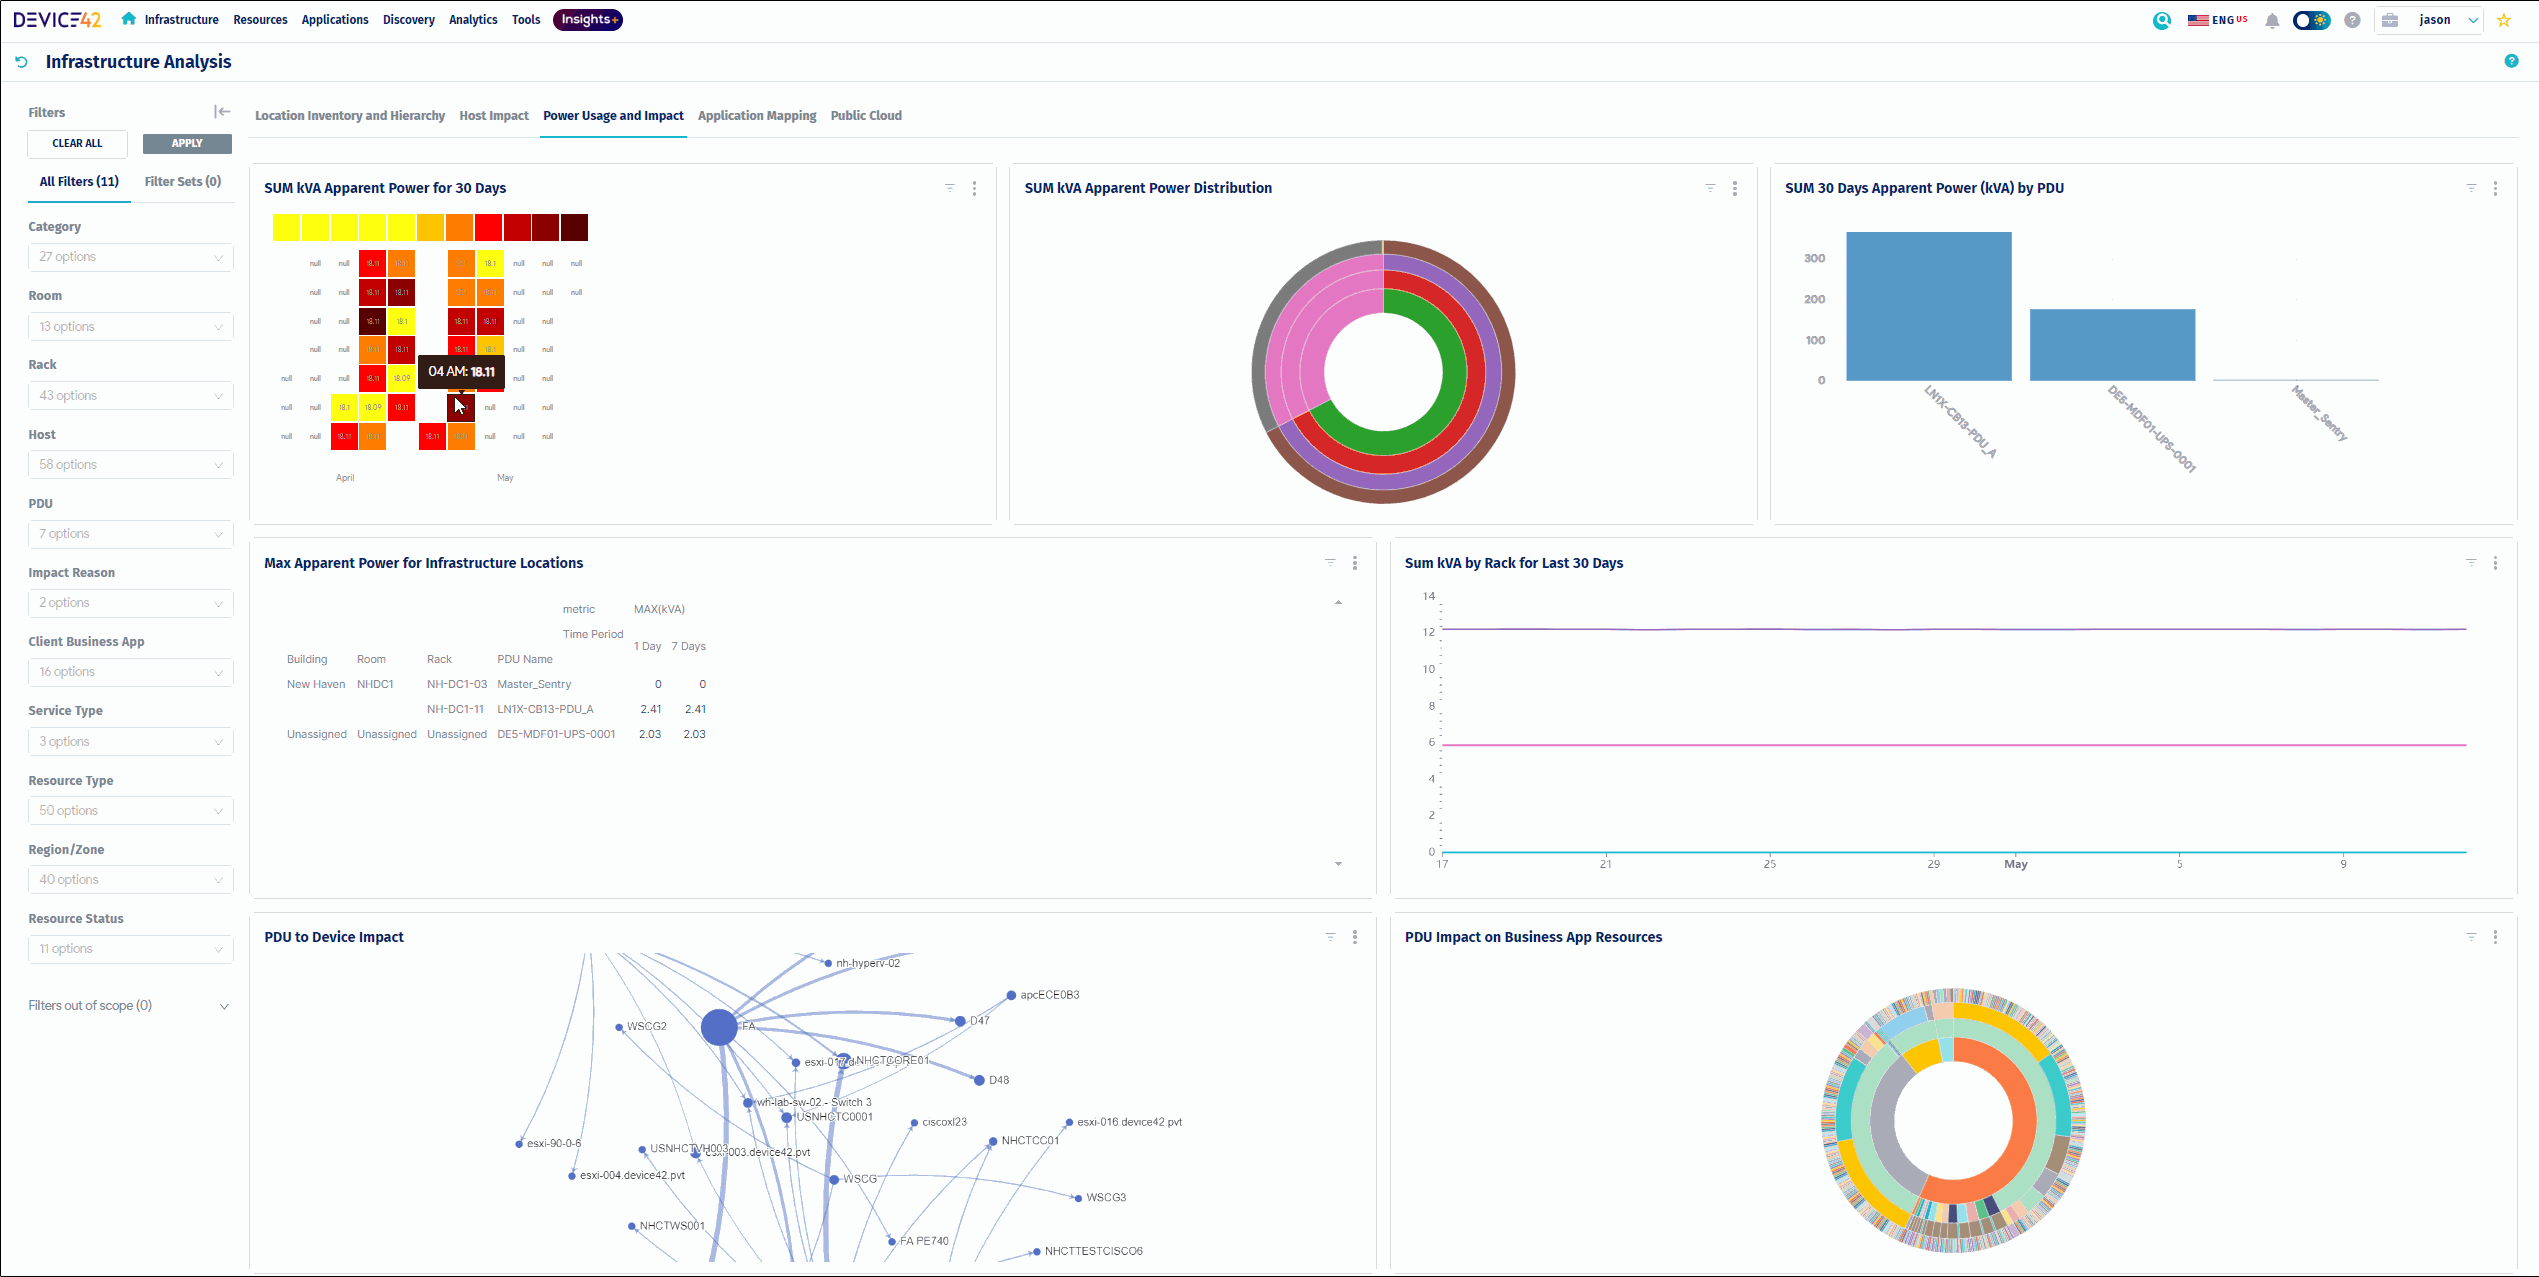
The Power Usage and Impact Dashboard provides you a consolidated view of power usage across your infrastructure to better manage capacity, identify trends, and document your carbon footprint. The dashboard also provides application dependency mapping that identifies the applications, infrastructure, and virtual devices dependent on the power distribution units (PDUs) to help you mitigate risks in the event of a failure.
Discover, Design, and Troubleshoot Application Environments
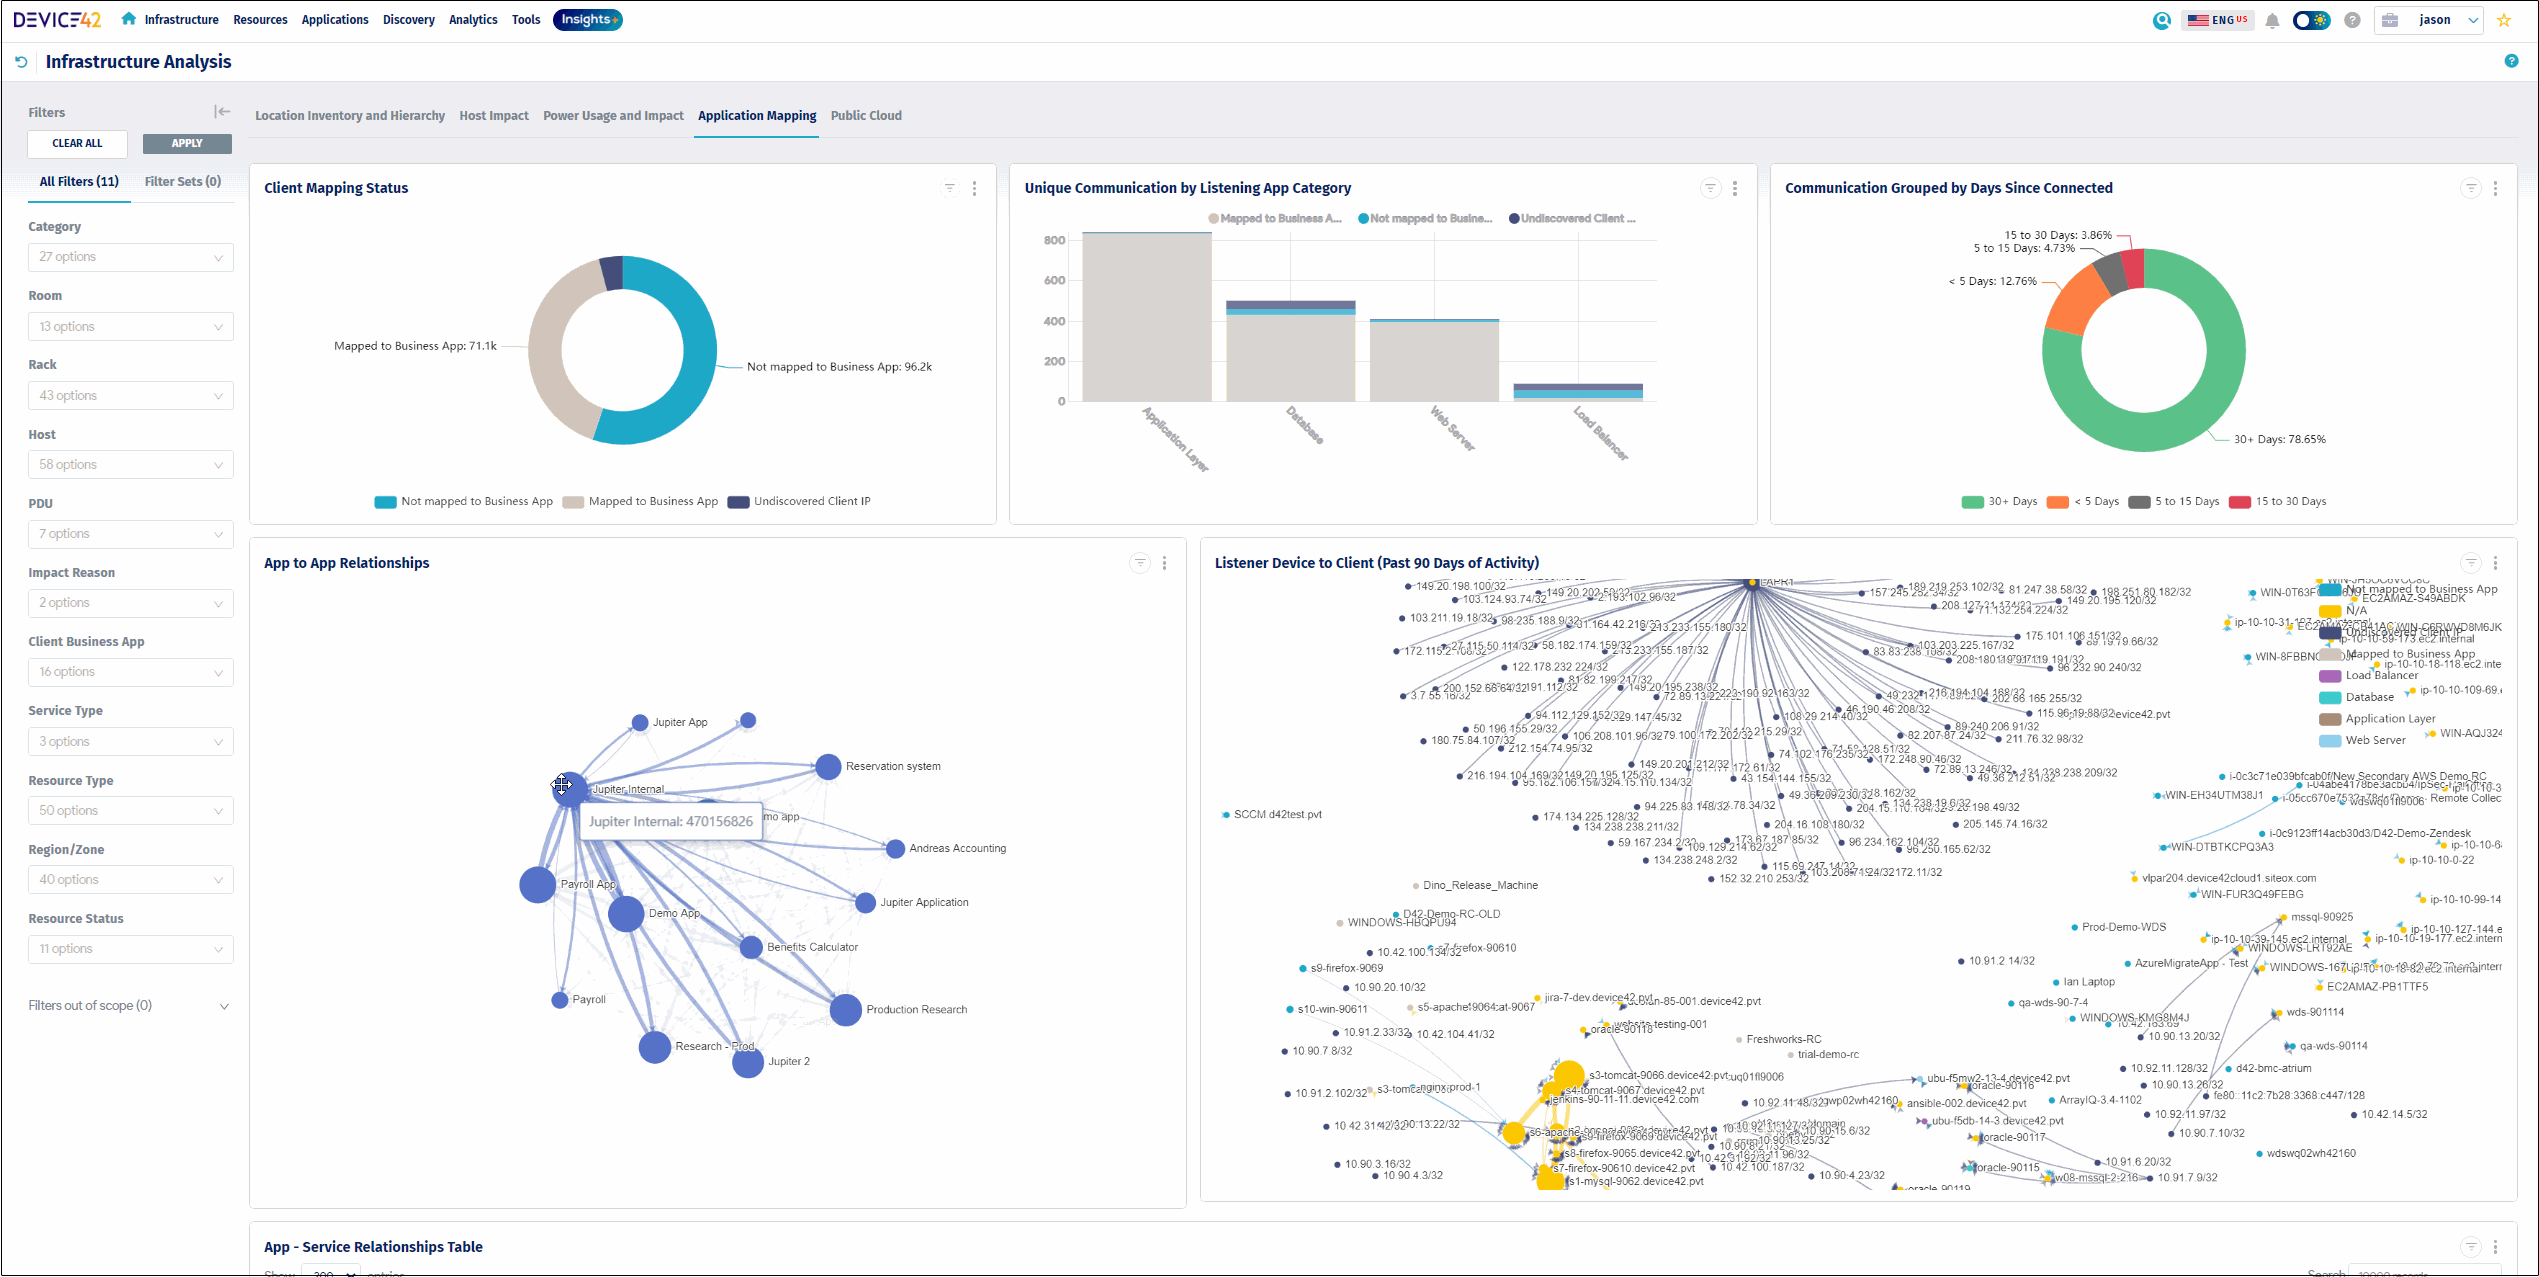
The Application Mapping Dashboard provides you a holistic view of your enterprise application environment, providing visualizations into the complex dependency chains in most environments. This crucial information can help you and your IT teams troubleshoot problems faster and plan for upcoming changes. Without this crucial information, mean-time-to-repair could be extended significantly.
Gain Cross-Cloud Visibility of Workloads
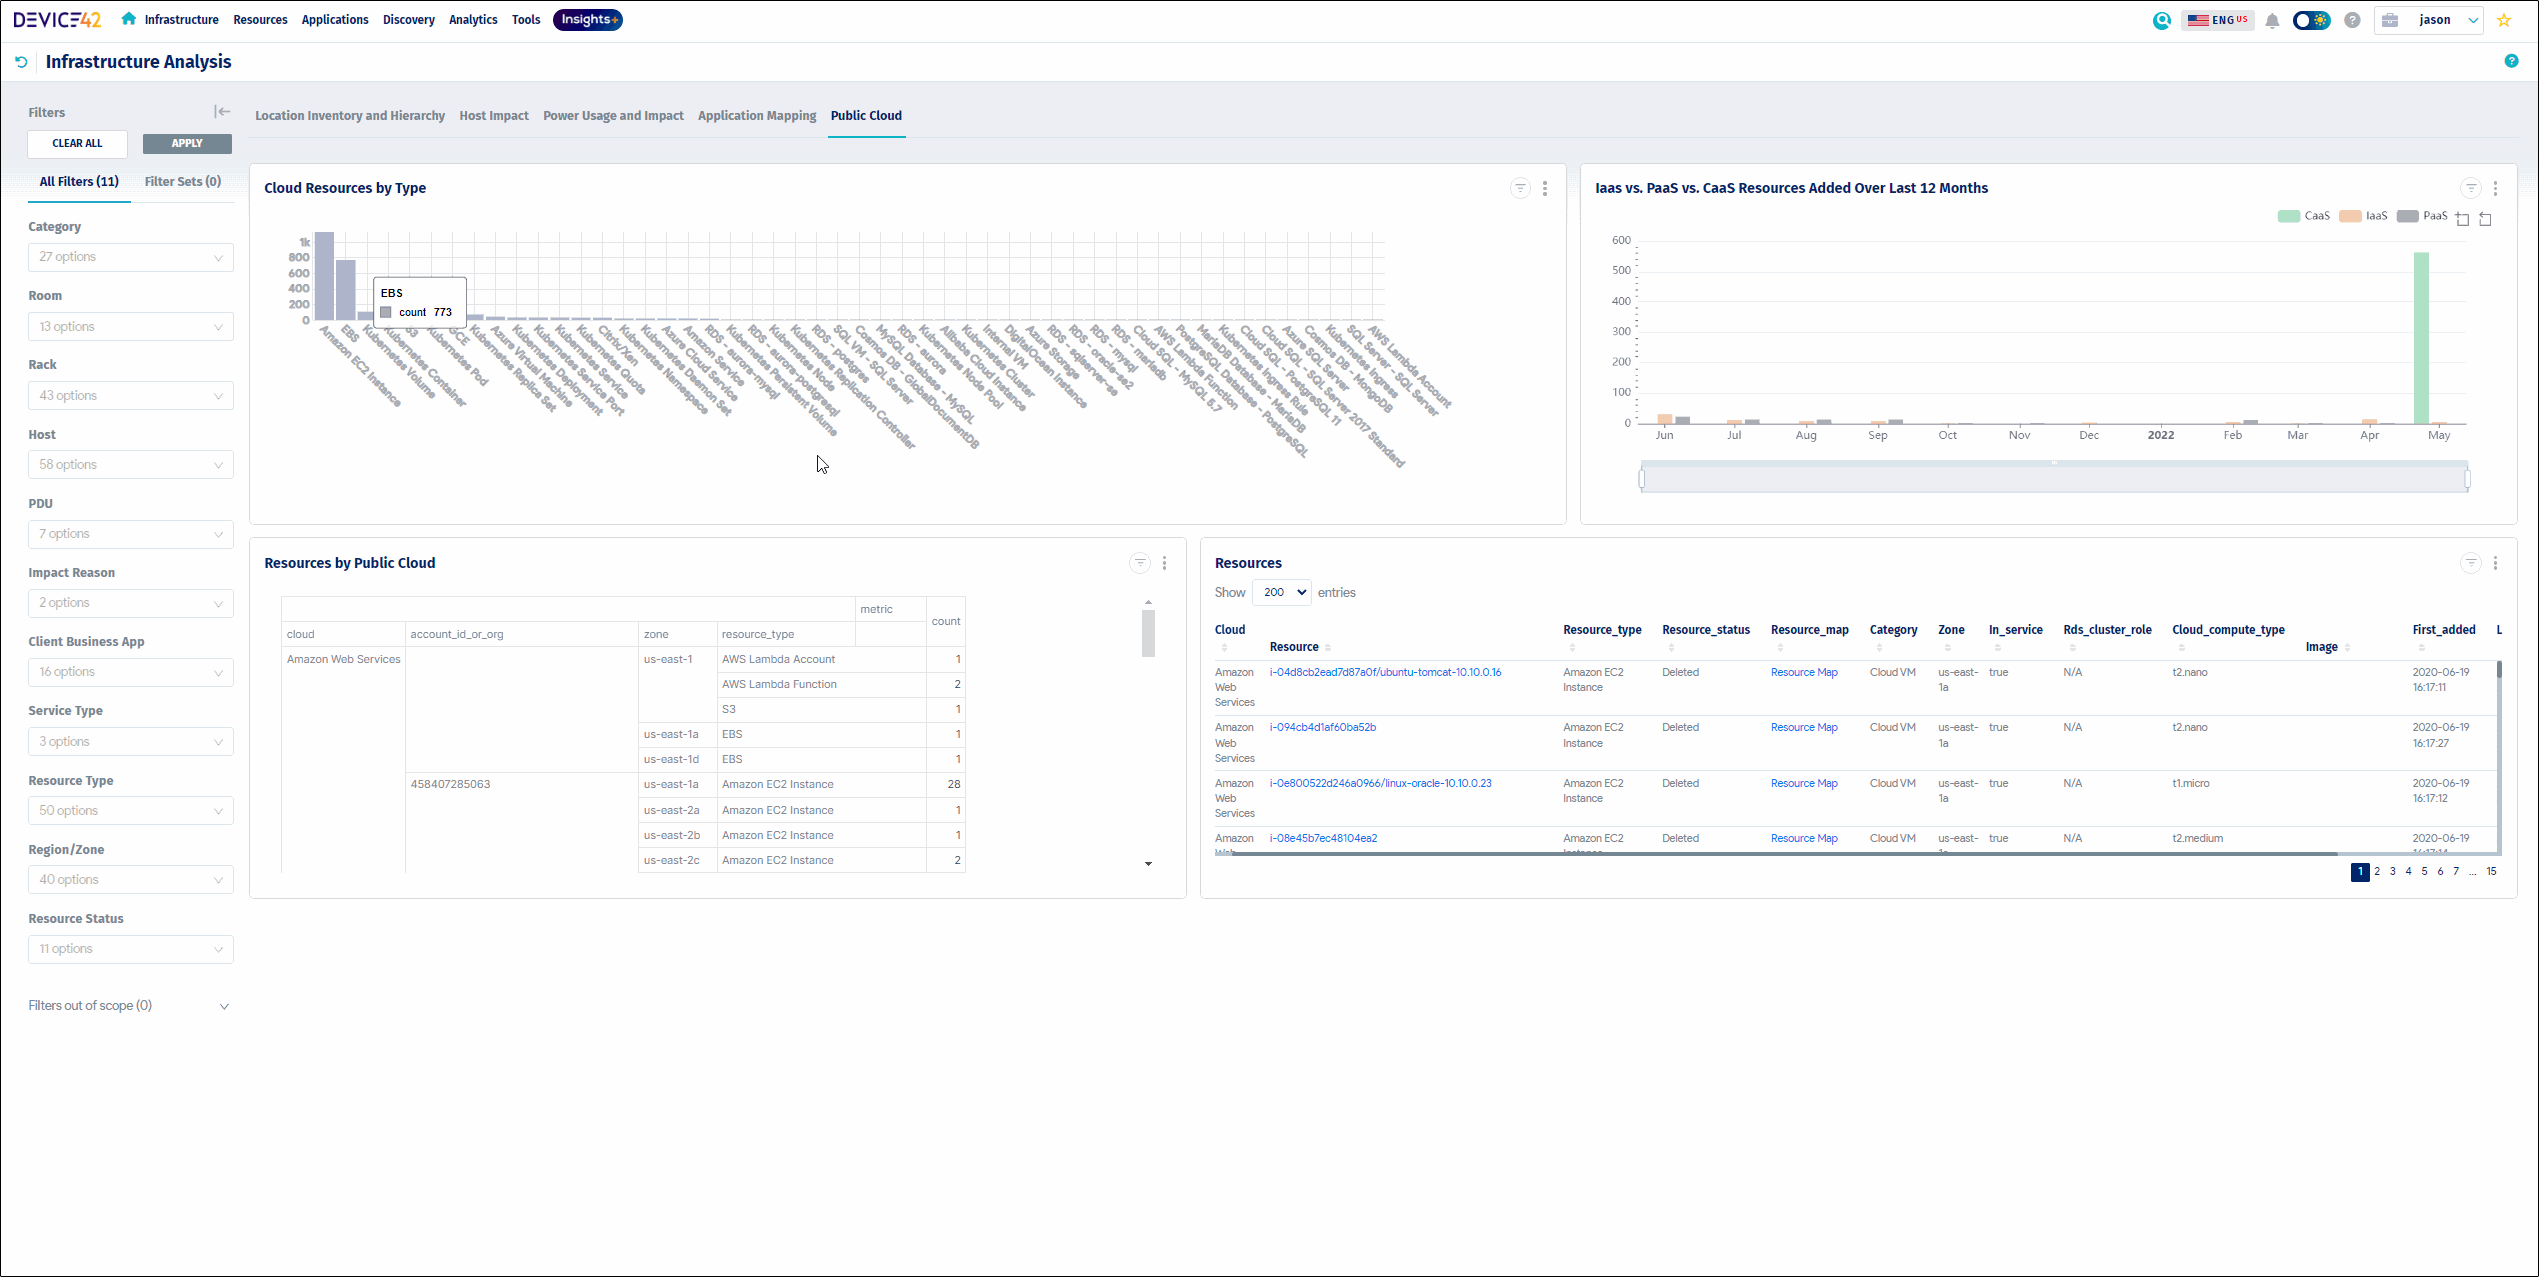
The Public Cloud Dashboard provides you crucial insights regarding your cloud consumption across all major cloud service providers. This helps you understand the resource types that are deployed, the progress of migrations, and the distribution of workloads to better control costs and ensure that cloud resources are being consumed in compliance with company standards.
Run IT with confidence.®