
Our two most frequently requested enhancements to Reports have been implemented in v5.3.0. You can now display custom fields that you have defined and filter on those custom fields. In addition, you can filter the Device and Asset reports by Building, Room, and/or Rack. Changes in v5.3.0 for improved Data Center Infrastructure Management are discussed below.
Displaying Custom Fields in the Report
[/responsive]
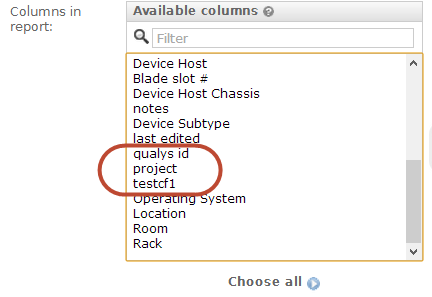
Any custom fields you define will be available for display in the report. In the example above, we have defined 3 custom fields (i.e. 3 custom key pairs) for Devices (qualsys id, project, and testcf1. If I were to selected all 3 fields as columns to go in the report, then we would see value portion of the 3 key / value pairs for each device will be displayed when you select this field for display.
[/responsive]
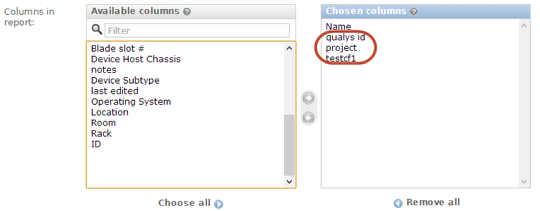
For example, if you select the name field plus the 3 custom fields, you will get a report with 4 columns that shows the name of each device in the first column and the values of the key / value pairs in the 2nd through 4th columns.
Please note that if you have also made a ‘value2’ entry, you will see both the ‘value’ and the ‘value2’ with a colon between them. For example, if the key / value pair is ‘qualsys id’ / ‘id1’ and the value2 is ‘security device’, then you will see ‘id1 : security device’ as the value displayed for the ‘qualsys id’ column.
Filtering on Custom Fields
[/responsive]
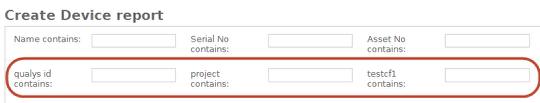
Each custom field will also appear with a ‘contains’ filter to enable you to filter the report by your custom fields.
Location based Filtering
[/responsive]
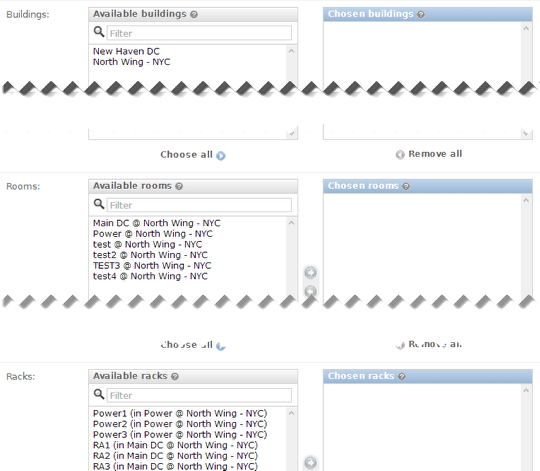
For the Device and Asset reports, you are now able to filter by Buildings, Rooms, and Racks. Simply choose one or more of each and the report will be limited to the Buildings, Rooms, and/or Racks selected.
Improved Switch Impact chart with direct connected or patch panel connected ports
 [/responsive]
Switch impact charts have been improved to display connectivity with devices or ports connected through patch panel ports. The switch impact chart processes connectivity in the following order for each port and stops at the first match:
1. Switch port to MAC address relationship.
2. Switch port remote port connectivity
3. Switch port direct device connection
4. Switch port to patch panel port connection(only followed if the patch panel connection is connected on both sides)
Rack display nameplate options
[/responsive]
In the rack layout, you can now choose to show serial #/asset # or no nameplate for devices/assets and PDUs.
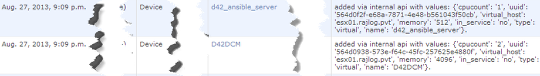
Audit log/history now includes auto-discovery logs
[/responsive]
History for most devices discovered through internal auto-discovery tools is now logged under Reports > History. Any additions or changes are recorded.
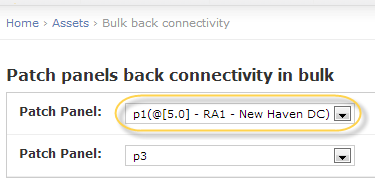
Cosmetic Enhancements to patch panel back connectivity page
[/responsive]
Patch panel drop downs now include the starting U location, rack and room for the patch panel(if it is racked). Also, for modular panels, the slot # of modules is now displayed.
Bug Fixes
- PDUs around the rack were not showing up in the rack display. Now fixed.
- If a patch panel port is patched to a tap port or another patch panel port, changing that port now clears the relationship on both sides. This prevents from any ghost relationships between patch panel/TAP port connectivity.
- Sample excel files for API imports are in Microsoft 97-2003 excel format instead of Open Office format. Also, excel files have been fixed to match the latest api calls.
Better Data Center Infrastructure Management with device42
Start managing your data center infrastructure in a better way with device42 using a 30 day free trial.
To update your current copy of device42, visit the device42 update page.