Vulnerability Management Metrics
Vulnerability management is no longer just about running a scanner and listing issues. In modern cloud-native and hybrid environments, effective metrics must go beyond raw counts to tell a full story about asset health, response capability, and real exposure to threats. While tooling and integrations are essential, the real challenge lies in embedding metrics into operational workflows. Without clear business prioritization, ownership, governance, and remediation processes, even the best dashboards remain unused.
Organizations need a set of practical, proven vulnerability management metrics that help them move from reactive patching to measurable risk reduction. They need a clear way to systematically reduce their organization’s risk, leveraging a clear set of vulnerability management metrics.
This article lays out a plan for accomplishing these goals by describing a clear set of baseline metrics and best practices that will improve any organization’s vulnerability management program. It also discusses more advanced best practices that create a continuously optimizing vulnerability management program. By the end of this article, you’ll have a clear blueprint for building vulnerability metrics that drive action, accountability, and measurable improvement.
Summary of best practices related to vulnerability management metrics
| Best practice | Description |
|---|---|
| Integrate a CMDB | Align vulnerability data with asset ownership, business context, and metadata. |
| Classify assets by criticality | Differentiate metrics by asset type and impact to ensure prioritization. |
| Track mean time to remediate (MTTR) | Measure and improve how quickly vulnerabilities are resolved. |
| Monitor SLA compliance | Assess adherence to internal remediation timelines and highlight breaches. |
| Include exposure windows | Track the duration between discovery and remediation, especially for exploited CVEs. |
| Correlate with threat intel | Enrich metrics with data on active exploitation and vulnerability age. |
| Normalize across tools | Ensure consistent measurement definitions across platforms and systems. |
Integrate a CMDB
The foundation of meaningful vulnerability metrics is an accurate, up-to-date asset database, known as a configuration management database (CMDB). While a CMDB may not directly contribute to vulnerability management metrics, its indirect impact is enormous.
For instance, consider a vulnerability management team that is trying to track down the potential impact of a recently released vulnerability. Their first action will be to find out whether their organization’s infrastructure contains the impacted systems. If the organization does have the impacted systems, the next step will be to find out how many. Then they will need to establish how critical these systems are and who they need to work with to get them remediated.
Without an effective CMDB, each of these steps goes from a 5-minute search to a multi-day, painfully slow process. When vulnerability exploitation can be measured in minutes and seconds, this lost time matters.
However, not all CMDBs are created equal. Choosing the right kind of CMDB matters. The rest of this section explores four considerations you should use when selecting a CMDB for your organization.
Choose a CMDB that can be constantly updated
In modern environments, systems are spun up and decommissioned rapidly, especially with infrastructure as code and dynamic cloud scaling. As a result, you need to choose a CMDB that has the capacity to be constantly and continuously updated with new information. This means going beyond a simple spreadsheet or manually updated process and choosing a dedicated system that can stream configuration management information from all of your infrastructure systems.
Enrich configuration management data
Since your CMDB receives a constant stream of information that defines the infrastructure picture of your environment, you need to ensure that it can enrich the results with the relevant metadata. This transforms your CMDB from a simple database of assets into a powerful tool that can be used throughout your organization when responding to cybersecurity incidents, vulnerability releases, and general infrastructure provisioning.
Typically, this process should include information that will help your teams know:
- What the asset is
- What it does
- How it is configured
- Who (or which team) is responsible for it
- Where it is located, both virtually and physically
- The criticality of the asset
- Any relationships and interdependencies with other assets in the organization
You may also find that your teams want to add other enriching information that will help them.


Discover assets automatically including hardware, software, and cloud infrastructure

Match the assets against your software and hardware license agreements

Comply with your service license needs comprehensively and confidently
Include automated discovery tools
Make sure your CMDB includes automated discovery tools, which help keep the CMDB accurate by continuously detecting new assets and updating changes in real time. When integrated properly, these tools reduce human error and ensure that high-value assets are never missed, acting as a silent partner to your infrastructure teams.
For even better results, choose a CMDB like Device42 that pairs automated discovery with automated asset metadata enrichment capabilities. This will ensure that every asset is enriched with the right metadata for your vulnerability management metrics.
Define a governance and lifecycle management process
In the current age of heavy automation, many organizations miss how essential a clear governance and lifecycle management process is. As a result, they find their vulnerability management metrics slowly drifting away from reality, which, in turn, increases the risk to the organization.
A clear governance process establishes the high-level requirements and policies for asset management, including ownership, review cycles, and validation rules. Lifecycle management processes then carry out these policies by executing the tasks needed to maintain compliance, such as removing obsolete systems promptly and ensuring that production systems remain visible and prioritized. Effective governance should also integrate risk management, including processes for risk acceptance, exception handling, and documenting compensating controls when remediation is not immediately feasible.
However, simply having a process is not enough. You should choose a CMDB that helps you manage your IT inventory as well as recording its current state. This reduces your manual overhead and also ensures that assets don’t slip through the gap (and become major incidents because someone forgot about them).
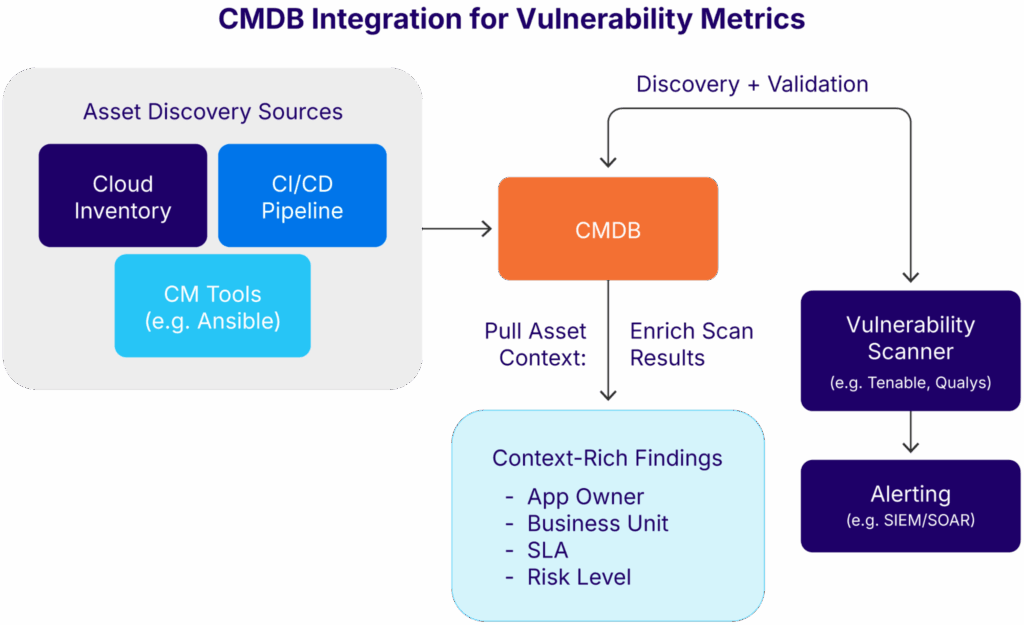
Conceptual illustration of an integration flow (source)
Classify assets by criticality
Not all vulnerabilities are created equal, and neither are the systems they impact. Measuring patching speed or service level agreement (SLA) adherence without accounting for asset sensitivity can lead to misleading conclusions and misplaced priorities.
The most effective vulnerability management metrics go beyond top-level SLAs to start breaking down assets by criticality. In this approach, assets are grouped into tiers based on their business impact and exposure level. This helps security teams focus on the systems that matter most before addressing lower-priority assets.
For instance, most organizations would want to remediate major internet-facing applications or environments containing regulated data before worrying about a developer’s laptop.
The table below demonstrates how this might work in practice (assuming the approach mentioned above). You can adapt this table to fit your organization’s specific risk profile.
| Tier | Description | Examples | Remediation Priority |
|---|---|---|---|
| Tier 1: Critical External | Public-facing production systems directly exposed to the internet | Web servers, customer portals | Immediate (hours/days) |
| Tier 2: Regulated Data Systems | Systems processing sensitive or regulated data | PCI environments, health record systems | High (days) |
| Tier 3: Core Internal Ops | Internal systems supporting critical business operations | ERP, finance, HR systems | Moderate (days/weeks) |
| Tier 4: Non-Production | Dev/test environments with no sensitive data | Lab servers, sandbox environments | Low (weeks) |
Align remediation expectations
Once assets are classified, you can align your remediation expectations accordingly. This process is partly technical and partly organizational.
For example, the table above shows that public-facing production systems should be treated with a higher priority than non-production test environments. To convert this table into reality, you should communicate these expectations to your teams and ensure that all assets are correctly identified as production or non-production.
It is here that you can see how critical your CMDB tool selection becomes. The right CMDB tool paired with the right governance framework ensures that all assets are correctly and automatically tagged with information such as business metadata, ownership, or network segmentation. This, in turn, sets the rest of the organization up for success in their vulnerability response.
Add specificity to metrics
At this point, you can start adding specificity to your vulnerability management metrics.
For instance, a common metric in vulnerability management is Mean Time to Detection (MTTD). However, an aggregate MTTD that calculates a raw average of all MTTD outcomes doesn’t add a lot of value for an organization.
Instead, now that you have a framework that clarifies when assets should be considered critical, you can modify your MTTD. One common way to do this is to separate your critical asset MTTD from your non-critical MTTD. Now you get a whole new level of insight into the relative effectiveness of your vulnerability management process.
Link your asset classification to your governance program
Note that asset classification must not be a one-time exercise. Embed it into onboarding and change management workflows so that new assets are automatically tagged correctly, avoiding rework and manual cleanup later. This process directly supports the earlier point on CMDB governance, where automated discovery, clear ownership, and lifecycle management ensure that asset data remains accurate and actionable for vulnerability metrics.
Track mean time to remediate (MTTR)
The ultimate measure of vulnerability risk reduction remains the time it takes the organization to remediate vulnerabilities, known as MTTR. Effectively, this tracks how much time it takes an organization to remove a known vulnerability from the organization.
However, the real value of an MTTR metric is its context. A flat average across all vulnerabilities rarely tells a useful story. Instead, break MTTR down by severity, asset class, and CVE type (e.g., RCEs vs. misconfigurations). This multi-dimensional view allows teams to see how remediation performance varies across different risk categories.
Here is one way to do this that can be modified for your organization:
| Severity | Asset Class | CVE Type | Average MTTR |
|---|---|---|---|
| Critical | Internet-facing systems | Remote code execution | 9 days |
| High | Regulated data systems | Privilege escalation | 14 days |
| Medium | Internal ops systems | Misconfiguration | 31 days |
| Low | Non-production systems | Informational weaknesses | 45 days |

How to calculate MTTR
Your MTTR figure can be derived from a variety of sources. Most organizations use a combination of scanner exports, SIEM data, and processed SQL queries from vulnerability dashboards.
If your organization does not already have a way to determine MTTR, a simple calculation by severity and asset class in SQL could look like this:
SELECT
  severity,
  asset_class,
  AVG(DATEDIFF(remediated_date, discovered_date)) AS mean_time_to_remediate
FROM vulnerabilities
WHERE status = 'closed'
GROUP BY severity, asset_class
ORDER BY severity DESC;
How to get insights from your MTTR calculation
You can add this information to the table from the section track mean time to remediate (MTTR). Assuming that all your assets are classified correctly, it becomes straightforward to identify where your organization is meeting targets and where delays are occurring.
Over time, you can derive even more value. For instance, by converting your MTTR calculations into trends, you can track whether your vulnerability management program is improving or stalling. When sudden, abnormal spikes occur, you can often discover contributing factors such as staffing issues, poor patch rollout planning, or regression in internal controls.
Going even further, you can leverage your MTTR insights to benchmark MTTR outcomes by business unit or system owner. This creates healthy competition across teams while also identifying bottlenecks. It can also be useful when certain teams are governed by specific regulatory frameworks.
Link to your governance framework
One critical aspect of your MTTR measurement must be mentioned here: It is pointless measuring and tracking vulnerability management metrics like MTTR if they are not paired with accountability. Set clear expectations with asset owners, ensure that SLA breaches trigger escalation, and hold regular remediation review sessions so teams know these numbers impact decision-making.
One effective approach is to set internal targets such as “critical vulnerabilities must be remediated within 10 business days” and then measure actual MTTR performance against those thresholds using SQL-based reports or dashboard automation to keep data visible to stakeholders.
Monitor SLA compliance
Once you have remediation SLAs defined, tracking adherence is essential. Doing so ensures that you maintain visibility into the performance of your vulnerability management metrics.
Monitoring SLA compliance gives you clear insight into your team’s capacity and operational discipline. It can also help you identify patterns of recurring delay, such as bottlenecks in change control processes or a lack of clarity in ownership. Using this information, you can prioritize further resource investment, identify bottlenecks, and ultimately improve your vulnerability management program.
The rest of this section outlines a practical approach to this monitoring.
Set targets based on asset specificity
As discussed in previous sections, SLAs should be specified according to the type of asset impacted and the severity of the vulnerability. This ensures that your vulnerability management metrics provide actionable insights that drive more effective remediation outcomes.
To turn these asset-specific SLAs into targets that can be monitored, convert the previous tables into numeric calculations that can be used further. For instance, in the previous sections, the examples established that:
- Critical assets should be remediated in hours/days.
- Critical assets with critical vulnerabilities take 9 days to remediate.
Clearly, this is suboptimal. If this was your vulnerability management program, it is likely that you would want to reduce the critical asset, critical vulnerability timeframe to less than a week. To do this, establish specific SLAs for each asset and vulnerability threshold. For instance, you could set thresholds as outlined in the following table.
| Severity Level | Asset Type | Target Resolution Time |
|---|---|---|
| Critical | Internet-facing systems | Within 5 business days |
| High | Regulated data environments | Within 7 business days |
| Medium | Internal business systems | Within 14 business days |
| Low | Non-production environments | Within 30 business days |
Automate metric calculation
Next, take your target resolution times and use them as inputs to an automated metric calculation. This ensures that the teams that receive asset remediation tickets are automatically provided with the target due date.
One straightforward way to do this is to set up automated calculations through integrations between your scanning platform and ticketing system. For example, if a scanner detects a critical vulnerability on a critical finance server, an automated ticket is generated in Freshservice with a due date 5 days from detection.
Assuming that your CMDB is providing accurate information, and you have established clear, numeric target resolution times, this should be a simple calculation for most ticketing or automation software.
Visualize SLAs
Visualizing your SLA outcomes on a dashboard provides visibility, insight, and immediate ownership. It makes it easier to spot where SLA targets are being missed, track patterns in breaches, and give both operational teams and leadership the data they need to address systemic issues and improve accountability.
Most organizations have an established pattern for how they prefer their dashboards; however, if you don’t, then use a service like Tableau to do it for you. Using the metric calculation data you collated in the previous sections, show information like:
- Overall SLA compliance percentages with clear pass/fail indicators
- SLA breach trends over time, helping identify recurring problem areas
- Segmentation of SLA performance by service category or priority level
- Quick identification of overdue items and at-risk tasks
Include exposure windows
Including exposure windows as part of your vulnerability management metrics requires a mature vulnerability management program. In general terms, this should include everything discussed in the previous sections, including an effective governance framework, CMDB, and automated ticketing functions. Once you have these foundational aspects in place, you’ll be ready to tackle exposure windows.
Exposure windows in the context of vulnerability management
A key blind spot in traditional vulnerability reporting is the real-world exposure window. This refers to the period between when a vulnerability becomes publicly known as exploitable and when it is fixed in your organization. It doesn’t mean that your organization was actually a victim of vulnerability exploitation (if so, that would be a job for your incident response team); however, it does mean that the possibility of active exploitation was known to exist.
Most scanning tools record when a CVE is detected and when it is closed, but they do not show how long systems were meaningfully exposed to real threats.
Why exposure windows matter
Consider a vulnerability disclosed on Day 1, publicly flagged as actively exploited on Day 5, and patched on Day 20. This creates a 15-day exposure window during which the vulnerability was known to be exploitable, but the affected systems remained unpatched. If the asset was externally exposed and lacked compensating controls, that period represents a significant risk.
Exposure windows reflect more than just patching speed; they show how well your team responds to real-world threat activity. Actively exploited vulnerabilities should move to the front of the queue. Treating them the same as lower-risk issues can delay response just when it matters most.
How to establish exposure windows
In most instances, exposure windows are established through the use of threat intelligence feeds. By integrating threat intelligence feeds with your vulnerability data, you can correlate exploit activity with asset exposure. For example, CISA’s Known Exploited Vulnerabilities list might flag a CVE as being used in attacks on Day 5.
One cautionary note here: Threat intelligence feeds, by nature, can be low-impact or contain false positives. Always validate threat intelligence against asset importance and business function to ensure remediation is focused where it truly matters.
How to leverage exposure windows
Including exposure windows in your vulnerability management program requires you to embrace dynamic remediation timeframes. All else being equal, once active exploitation of a known vulnerability has been reported, your remediation steps should be turbocharged. In practical terms, this may mean that the engineering team that thought they had 5 days to remediate a critical vulnerability now only has 48 hours. Obviously, this puts tremendous and unexpected pressure on those teams.
To make this process easier, add an extra column to your earlier SLA table that contains a call-out for known external exploitation. Using the same systems established in earlier sections, socialize this extra column to all your teams. Then include an extra measurement in your dashboards that tracks your exposure window.
Correlate with threat intelligence
The next advanced practice in your vulnerability management metrics is the inclusion of threat intelligence.
Why threat intelligence matters
Most organizations base their vulnerability criticality assessment on the standard CVSS score. The problem with this approach is that a CVSS score is calculated in a way that is completely agnostic of the context in which the vulnerability may exist and be exploited. For instance, a vulnerability that is exceptionally difficult to exploit but would have a catastrophic impact if it were theoretically exploited would receive a higher CVSS rating than an exploit that was easy to develop exploits for and was relatively widespread.
In the real world, it simply doesn’t work this way, and mature vulnerability management programs take this into account. Real risk comes from a combination of exploitation likelihood, adversary capability, and exploit availability. You get this kind of information from your threat intelligence feeds.
How to integrate threat intelligence
Integrate threat intelligence into your vulnerability management metrics by interfacing with threat intelligence feeds such as:
- CISA Known Exploited Vulnerabilities (KEV)
- MISP (open-source threat intel platform)
- Commercial threat intelligence feeds
Next, start calculating a risk score that combines CVSS severity with threat intelligence signals. One widely used approach is the Exploit Prediction Scoring System (EPSS), which estimates the probability that a vulnerability will be exploited in the wild within a given time frame.
Alternatively, you may choose to develop a custom formula that incorporates threat feed tagging, asset criticality, and exposure context tailored to your environment. For example:
Risk Score = (CVSS Base Score * Exploit Availability Weight) + Asset Criticality Weight
- Exploit Availability Weight could be higher if the vulnerability appears in KEV or has public proof-of-concept code.
- Asset Criticality Weight reflects the business impact of the affected system (for example, external-facing production vs. internal test lab).
Either of these approaches will give you a more realistic priority list than CVSS alone, focusing your resources on vulnerabilities that are both exploitable and impactful to the business.
How to leverage threat intelligence
As with the other best practices, make sure that these new metrics flow through to your dashboards, prioritization systems, and ticketing capabilities. For your dashboards, develop reports and visualizations based on:
- How many actively exploited vulnerabilities remain open
- Average response time for exploited CVEs
- Vulnerabilities addressed before public exploit release
Normalize across tools
Most large environments use more than one scanning solution. For instance, web app scanning, container scanning, infrastructure scanning, and code analysis tools often use different schemas and definitions. Without normalization, your metrics will conflict and mislead stakeholders. With it, you gain a single source of truth for measurement.
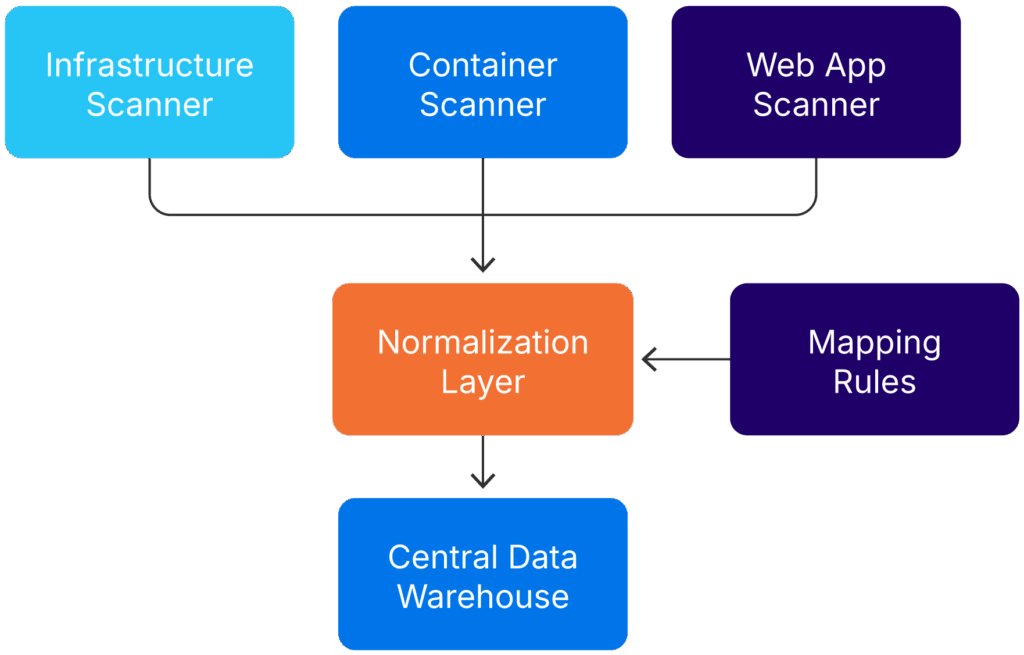
Normalization of incoming automated scan data (source)
Key areas to normalize
Although every organization has a unique blend of tools it uses to monitor infrastructure, there are three key aspects that should be normalized:
- Status definitions (e.g., open, resolved, risk accepted)
- Severity ratings (CVSS vs. vendor-specific scoring)
- Time calculations (discovery date vs. import date)
This often requires an extract, transform, load (ETL) process or a central data warehouse where all vulnerability data is ingested, transformed, and tagged.
Develop a metrics data dictionary
Create a metrics data dictionary that standardizes terms and data fields across systems. This becomes especially valuable during audits, M&A due diligence, and strategic planning. It can be as simple as a globally accessible spreadsheet with terms and definitions or a more complex, formally managed table.
Conclusion
Metrics are the connective tissue between scanning tools and strategic decisions. When well-designed and consistently applied, they drive accountability, expose bottlenecks, and guide security investments.
Start small. Track MTTR and SLA compliance reliably. Then layer on threat intelligence, exposure windows, and asset criticality. Above all, make sure your data reflects real-world risk, not just scanner output.
Vulnerability management is a continuous process. With the right metrics in place, it becomes a measurable, improvable program that earns the confidence of both technical teams and business leaders.
Metrics that lack connection to operational action or business accountability become noise. The best metrics move the organization forward. Ultimately, it’s the processes, governance, and culture behind the metrics that make them impactful. Tools and dashboards amplify good practices but cannot replace structured workflows, clear ownership, and consistent follow-through.